

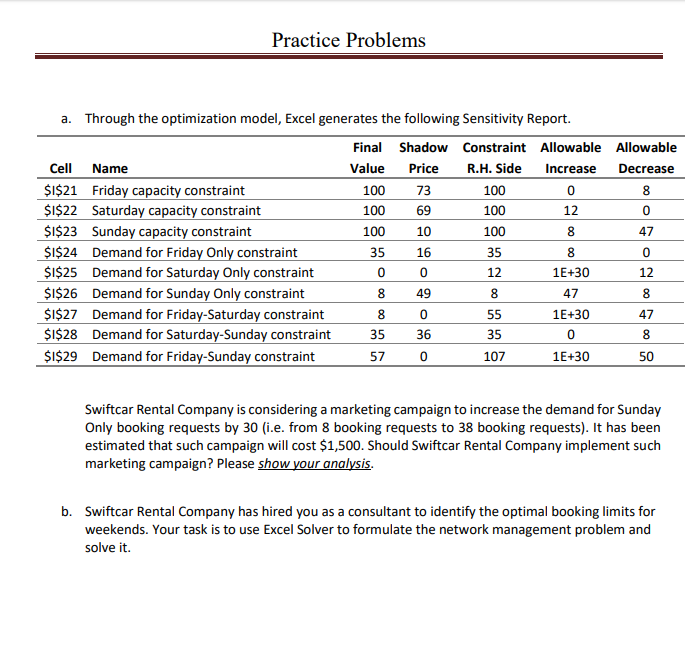
Question: Practice Problems a. Through the optimization model, Excel generates the following Sensitivity Report. Final Value 100 100 100 Constraint Allowable Allowable R.H. Side Increase Decrease
Step by Step Solution
There are 3 Steps involved in it
1 Expert Approved Answer
Step: 1 Unlock

Question Has Been Solved by an Expert!
Get step-by-step solutions from verified subject matter experts
Step: 2 Unlock
Step: 3 Unlock