

Question: Please solve Prepare a graph to shows your order point determination. Fill in the table Item Total demand Ordering cost Carrying cost Delivery time stock
Please solve 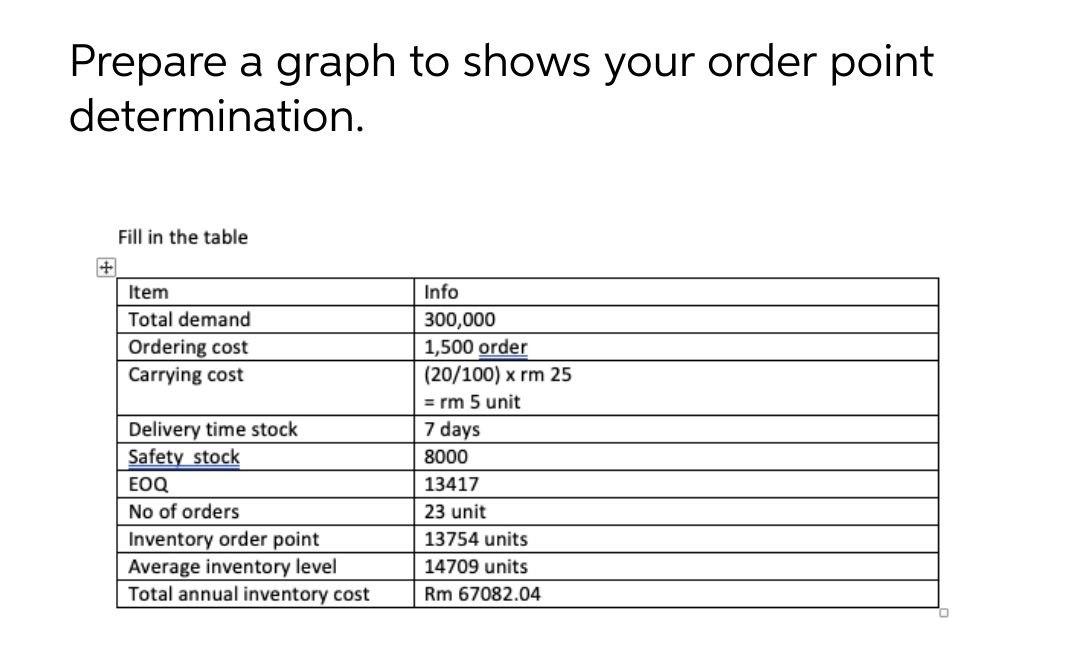
Prepare a graph to shows your order point determination. Fill in the table Item Total demand Ordering cost Carrying cost Delivery time stock Safety stock EOQ No of orders Inventory order point Average inventory level Total annual inventory cost Info 300,000 1,500 order (20/100) x rm 25 = rm 5 unit 7 days 8000 13417 23 unit 13754 units 14709 units Rm 67082.04
Step by Step Solution
There are 3 Steps involved in it
1 Expert Approved Answer
Step: 1 Unlock

Question Has Been Solved by an Expert!
Get step-by-step solutions from verified subject matter experts
Step: 2 Unlock
Step: 3 Unlock