

Question: Presented below are the 2018 income statement and comparative balance sheets for Santana Industries 19 Income Statement For the Year Ended December 31, 2018 4.16
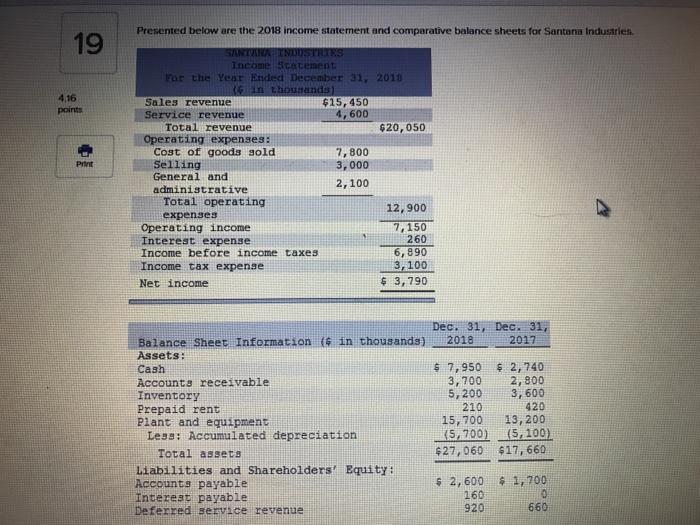
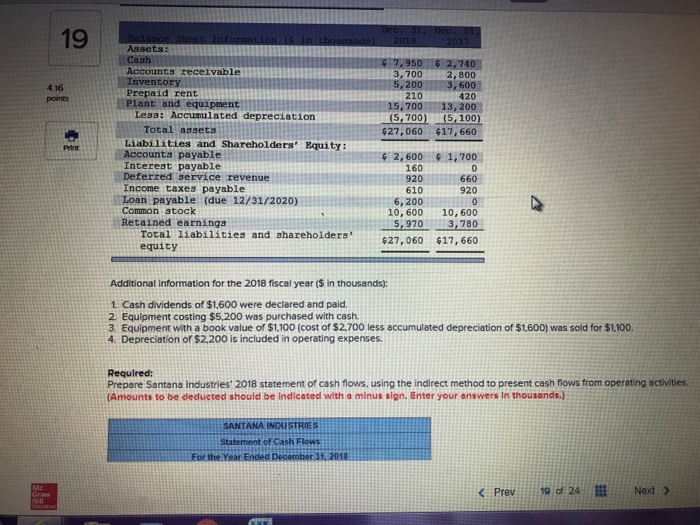
Presented below are the 2018 income statement and comparative balance sheets for Santana Industries 19 Income Statement For the Year Ended December 31, 2018 4.16 points Sa??? revenue Service revenue Operating expenses: $15,450 4, 600 Total revenue 620,050 Cost of goods sold selling General and administrative 7,800 3,000 2,100 Print Total operating expenses 12,900 Operating income Interest expense 7,150 260 Income before income taxes Income tax expense Net income 6, 890 3,100 $ 3,790 Dec. 31, Dec. 31, Balance Sheet Information (s in thousands) Assets: Cash Accounts receivable Inventory Prepaid rent Plant and equipment 20182017 5 7,950 2,740 3,700 2,800 5, 200 3, 600 420 15,70013,200 210 5.700) (5,100) $27, 060 $17,660 Less: Accumulated depreciation Total assets Liabilities and Shareholders Equity Accounts payable Interest payable Deferred service revenue 2, 6001,700 160 920 660
Step by Step Solution
There are 3 Steps involved in it

Get step-by-step solutions from verified subject matter experts