

Question: Presented below are two sets of data. Firstly, review the absence data that is presented in Table 1 and provide analysis of it to show:
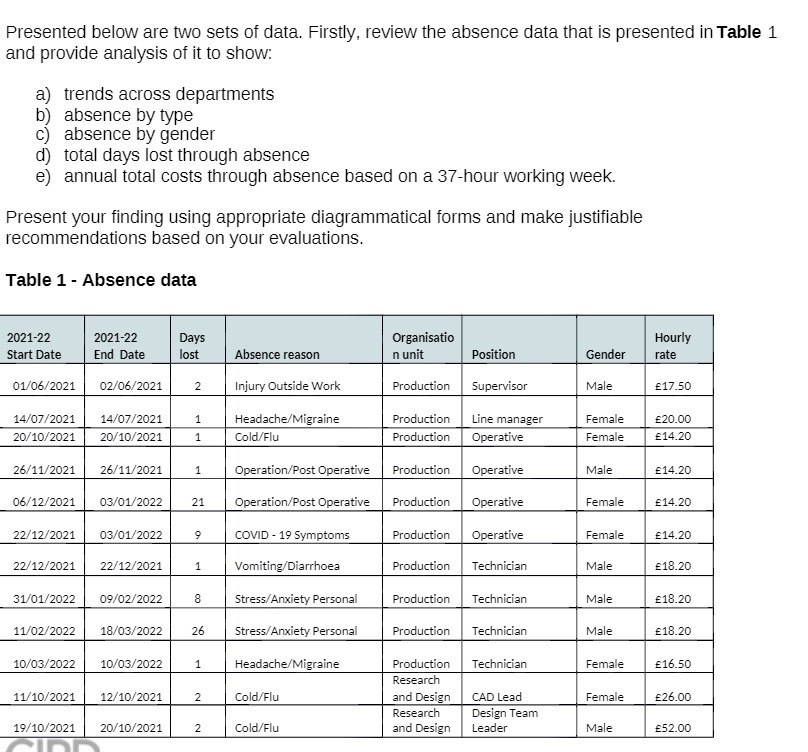
Presented below are two sets of data. Firstly, review the absence data that is presented in Table 1 and provide analysis of it to show: a) trends across departments absence by type absence by gender total days lost through absence e) annual total costs through absence based on a 37-hour working week. Present your finding using appropriate diagrammatical forms and make justifiable recommendations based on your evaluations. Table 1 - Absence data 2021-22 2021-22 Days Organisation Hourly Start Date End Date lost Absence reason n unit Position Gender rate 01/06/2021 02/06/2021 2 Injury Outside Work Production Supervisor Male E17.50 14/07/2021 14/07/2021 1 Headache/Migraine Production Line manager Female E20.00 20/10/2021 20/10/2021 Cold/Flu Production Operative Female E14.20 26/11/2021 26/11/2021 Operation/Post Operative Production Operative Male E14.20 06/12/2021 03/01/2022 21 Operation/Post Operative Production Operative Female E14.20 22/12/2021 03/01/2022 COVID - 19 Symptoms Production Operative Female E14.20 22/12/2021 22/12/2021 1 Vomiting/Diarrhoea Production Technician Male E18.20 31/01/2022 09/02/2022 8 Stress/Anxiety Personal Production Technician Male E18.20 11/02/2022 18/03/2022 Stress/Anxiety Personal Production Technician Male E18.20 10/03/2022 10/03/2022 Headache/Migraine Production Technician Female E16.50 Research 11/10/2021 12/10/2021 2 Cold/Flu and Design CAD Lead Female E26.00 Research Design Team 19/10/2021 20/10/2021 2 Cold/Flu and Design Leader Male E52.00
Step by Step Solution
There are 3 Steps involved in it

Get step-by-step solutions from verified subject matter experts