

Question: PRINTER VERSION BACK NEXT Exercise 18-8 Selected comparative statement data for Queen Products Company are presented below. All balance sheet data are as of December
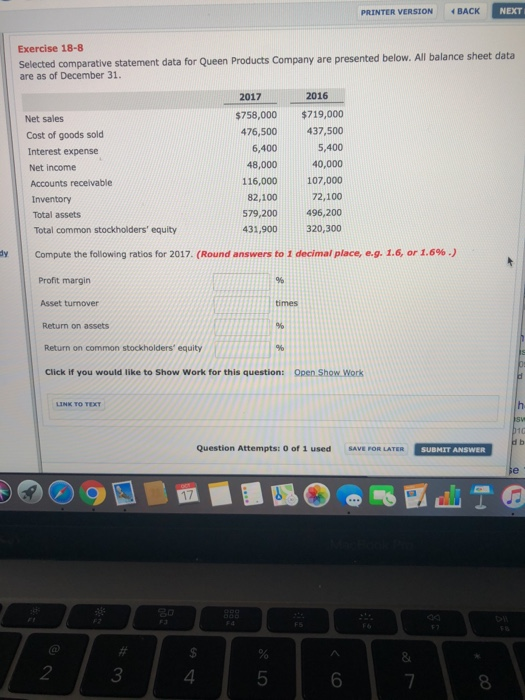
PRINTER VERSION BACK NEXT Exercise 18-8 Selected comparative statement data for Queen Products Company are presented below. All balance sheet data are as of December 31. 2017 2016 $758,000 $719,000 476,500437,500 5,400 40,000 107,000 82,10072,100 79,200496,200 431,900 320,300 Net sales Cost of goods sold 6,400 48,000 116,000 Interest expense Net income Accounts receivable Inventory Total assets Total common stockholders' equity by Compute the following ratios for 2017. (Round answers to 1 decimal place, eg. 1.6, or 1.6% .) Profit margin Asset turnover Return on assets Return on common stockholders' equity Click if you would like to Show Work for this question: Open Show Work Question Attempts: 0 of 1 used SAVE POR LATER 8 2 3 4 5 6 8
Step by Step Solution
There are 3 Steps involved in it

Get step-by-step solutions from verified subject matter experts