

Question: Exercise 14-8 Selected comparative statement data for Queen Products Company are presented below. All balance sheet data are as of December 31 2017 2016 Net
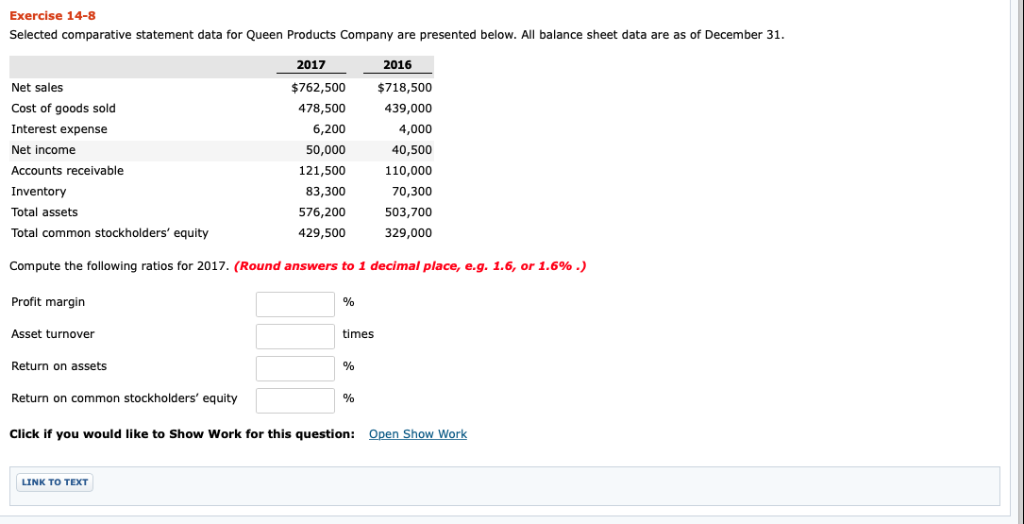
Exercise 14-8 Selected comparative statement data for Queen Products Company are presented below. All balance sheet data are as of December 31 2017 2016 Net sales Cost of goods sold Interest expense Net income Accounts receivable Inventory Total assets Total common stockholders' equity $762,500 $718,500 439,000 4,000 40,500 110,000 70,300 503,700 329,000 478,500 6,200 50,000 121,500 83,300 576,200 429,500 Compute the following ratios for 2017, (Round answers to 1 decimal place, e.g. 1.6, or 1.6% .) Profit margin Asset turnover times Return on assets Return on common stockholders' equity Click if you would like to Show Work for this question: Sh LINK TO TEXT
Step by Step Solution
There are 3 Steps involved in it

Get step-by-step solutions from verified subject matter experts