

Question: Exercise 18-8 Selected comparative statement data for Queen Products Company are presented below. All balance sheet data are as of December 31 2016 2017 Net
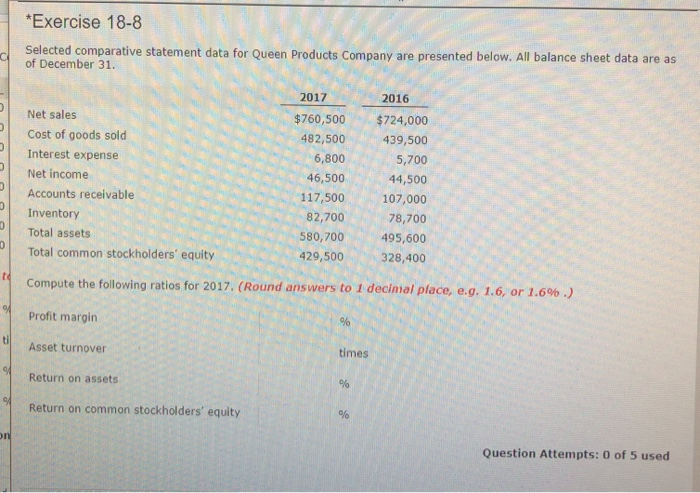
Exercise 18-8 Selected comparative statement data for Queen Products Company are presented below. All balance sheet data are as of December 31 2016 2017 Net sales $760,500 $724,000 482,500439,500 Cost of goods sold 6,800 Interest expense 5,700 Net income 46,500 44,500 107,000 117,500 Accounts receivable 82,700 78,700 Inventory 0Total assets 580,700495,600 Total common stockholders' equity 429,500328,40o r 1.6% .) Compute the following ratios for 2017. (Round answers to 1 decimal place, e.g. 1.6, o Profit margin times Asset turnover Return on assets Return on common stockholders' equity Question Attempts: 0 of 5 used
Step by Step Solution
There are 3 Steps involved in it
1 Expert Approved Answer
Step: 1 Unlock

Question Has Been Solved by an Expert!
Get step-by-step solutions from verified subject matter experts
Step: 2 Unlock
Step: 3 Unlock