

Question: Probability p ( x 2 )* Table entry for p is the critical value (x2)* with probability p lying to its right. TABLE F x2
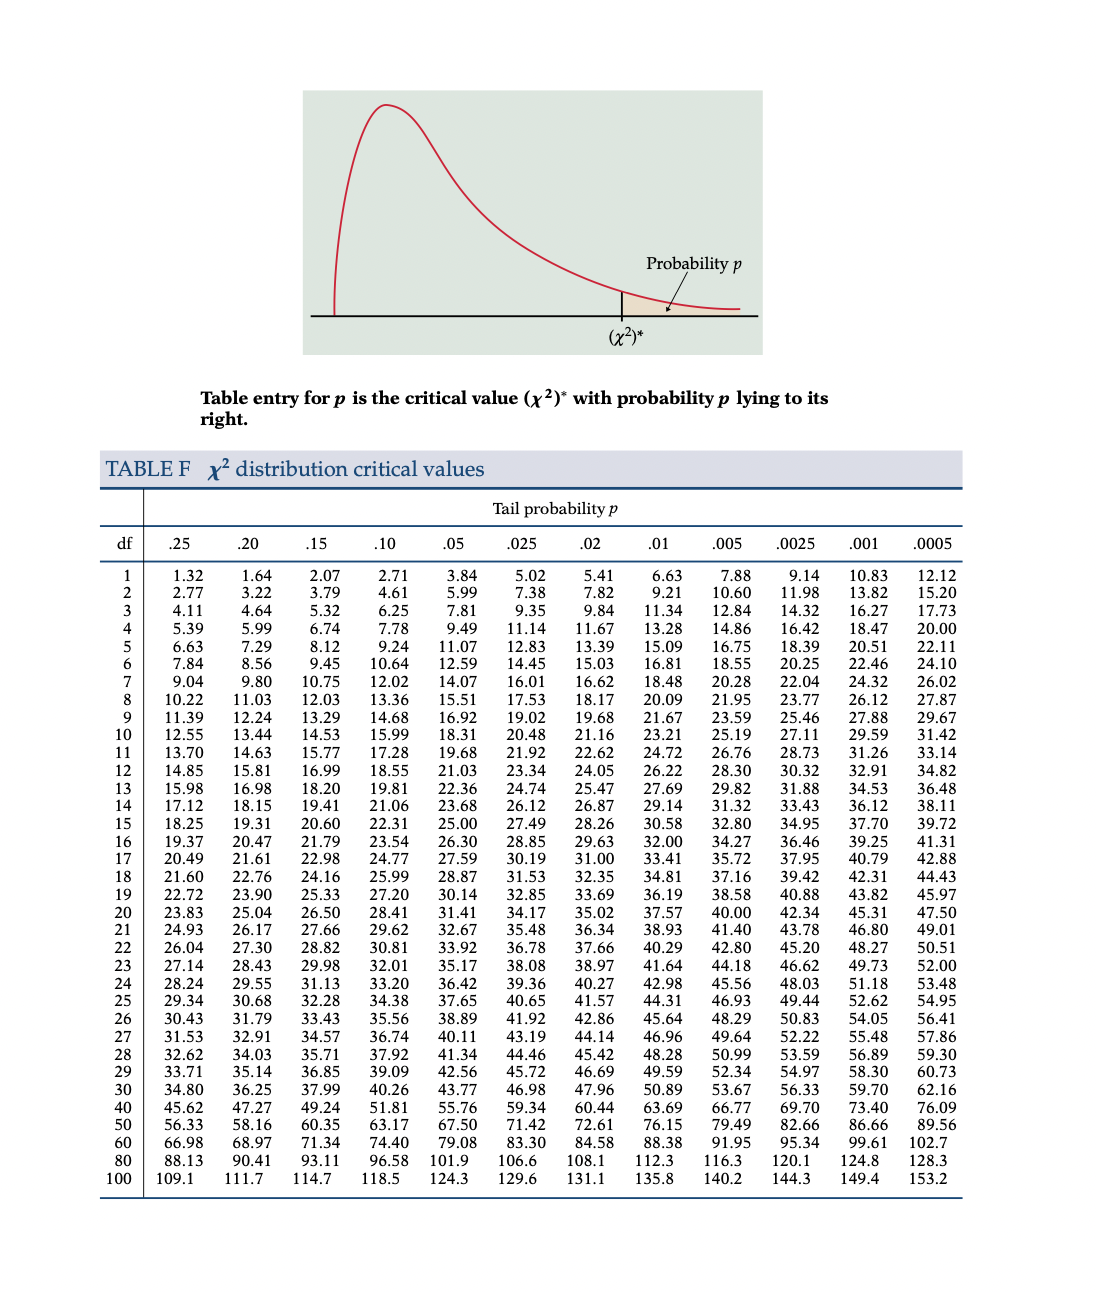
Probability p ( x 2 )* Table entry for p is the critical value (x2)* with probability p lying to its right. TABLE F x2 distribution critical values Tail probability p .01 005 .0025 .001 0005 .15 .02 df .25 20 .10 .05 025 2.07 2.71 3.84 5.02 5.41 6.63 7.88 9.14 10.83 12.12 1.32 1.64 3.22 3.79 4.61 5.99 7.38 7.82 9.21 10.60 11.98 13.82 15.20 2.77 9.35 9.84 11.34 12.84 14.32 16.27 17.73 4.11 4.64 5.32 6.25 7.81 18.47 20.00 5.9 6.74 7.78 9.49 11.14 11.67 13.28 14.86 16.42 5.39 7.29 8.12 9.24 11.07 12.83 13.39 15.09 16.75 18.39 20.51 22.11 6.63 12.59 14.45 15.03 16.81 18.55 20.25 22.46 24.10 7.84 8.56 9.45 10.64 18.48 20.28 22.04 24.32 26.02 9.04 9.80 10.75 12.02 14.07 16.01 16.62 26.12 27.87 10.22 11.03 12.03 13.36 15.51 17.53 18.17 20.09 21.95 23.77 27.88 29.67 11.39 12.24 13.29 14.68 16.92 19.02 19.68 21.67 23.59 25.46 29.59 31.42 12.55 13.44 14.53 15.99 18.31 20.48 21.16 23.21 25.19 27.11 26.76 28.73 31.26 33.14 13.70 14.63 15.77 17.28 19.68 21.92 22.62 24.72 23.34 24.05 26.22 28.30 30.32 32.91 34.82 14.85 15.81 16.99 18.55 21.03 29.82 31.88 34.53 36.48 15.98 16.98 18.20 19.81 22.36 24.74 25.47 27.69 26.12 26.87 29.14 31.32 33.43 36.12 38.11 17.12 18.15 19.41 21.06 23.68 18.25 19.31 20.60 22.31 25.00 27.49 28.26 30.58 32.80 34.95 37.70 39.72 19.37 21.79 23.54 26.30 28.85 29.63 32.00 34.27 36.46 39.25 41.31 20.47 24.77 27.59 30.19 31.00 33.41 35.72 37.95 40.79 42.88 17 20.49 21.61 22.98 24.16 25.99 28.87 31.53 32.35 34.81 37.16 39.42 42.31 44.43 18 21.60 22.76 27.20 30.14 32.85 33.69 36.19 38.58 40.88 43.82 45.97 19 22.72 23.90 25.33 47.50 23.83 25.04 26.50 28.41 31.41 34.17 35.02 37.57 40.00 42.34 45.31 43.78 46.80 49.01 24.93 26.17 27.66 29.62 32.67 35.48 36.34 38.93 41.40 30.81 33.92 36.78 37.66 40.29 42.80 45.20 48.27 50.51 26.04 27.30 28.82 44.18 46.62 49.73 52.00 27.14 28.43 29.98 32.01 35.17 38.08 38.97 41.64 33.20 36.42 39.36 40.27 42.98 45.56 48.03 51.18 53.48 28.24 29.55 31.13 44.31 46.93 49.44 52.62 54.95 25 29.34 30.68 32.28 34.38 37.65 40.65 41.57 50.83 54.05 56.41 26 30.43 31.79 33.43 35.56 38.89 41.92 42.86 45.64 48.29 52.22 55.48 57.86 27 31.53 32.91 34.57 36.74 40.11 43.19 44.14 46.96 49.64 45.42 48.28 50.99 53.59 56.89 59.30 28 32.62 34.03 35.71 37.92 41.34 44.46 54.97 58.30 60.73 29 33.71 35.14 36.85 39.09 42.56 45.72 46.69 49.59 52.34 40.26 43.77 46.98 47.96 50.89 53.67 56.33 59.70 62.16 30 34.80 36.25 37.99 63.69 66.77 69.70 73.40 76.09 47.27 49.24 51.81 55.76 59.34 60.44 40 45.62 72.61 76.15 79.49 82.66 86.66 89.56 56.33 58.16 60.35 63.17 67.50 71.42 50 84.58 88.38 91.95 95.34 99.61 102.7 50 66.98 68.97 71.34 74.40 79.08 83.30 124.8 128.3 88.13 90.41 93.11 96.58 101.9 106.6 108.1 112.3 116.3 120.1 80 135.8 140.2 144.3 149.4 153.2 100 109.1 111.7 114.7 118.5 124.3 129.6 131.1Criminologisis have long debated whether there is a relationship between weather conditions and the incidence of violent crime. The author or an article classied 1364 homicides according to season, resulting in the accompanying data. Test the null hypothesis of equal proportions using or = 0.05. (Right-click chi-square [able to open a chlsquare table in a separate tab or new window). Winter Spring Summer Fall 330 335 372 327 State the appropriate hypotheses. H0: P1 = '72 P: = P4 = 015 Ha: no p 0.15 Ho: p1 =p2 =p3 =p4 = 0.25 H3: at least one pldoes not equal 025 H0: 91 an '93 :94 s 0.25 Ha: all pi's = 0,25 Ho: '71 tpz x173 3,74 3 0.15 H3: at least one p,- = 0.25 Campute the test statistic Value. (Raund your answer to three decimal places.) ,2 = What can we say about the Pvalue? P-value 0.10 State le conclusion in the problem context. Fail to reject Ho. There is no evidence that there is a seasonal relationship between weather conditions and the incidence of violent crime. Reject No. There is no evidence that there is a seasonal relationship between weather conditions and the incidence of violent crime. a Fail to reject Ho. There is evidence that there is a seasonal relationship between weather conditions and the incidence of violent crime. Reject No. There is evidence that there is a seasonal relationship between weather conditions and the incidence of violent crime
Step by Step Solution
There are 3 Steps involved in it

Get step-by-step solutions from verified subject matter experts