

Question: PROBLEM 1 ( 2 0 points ) : Make a polar plot of the function: r = + - 2 for 0 5 The plot,
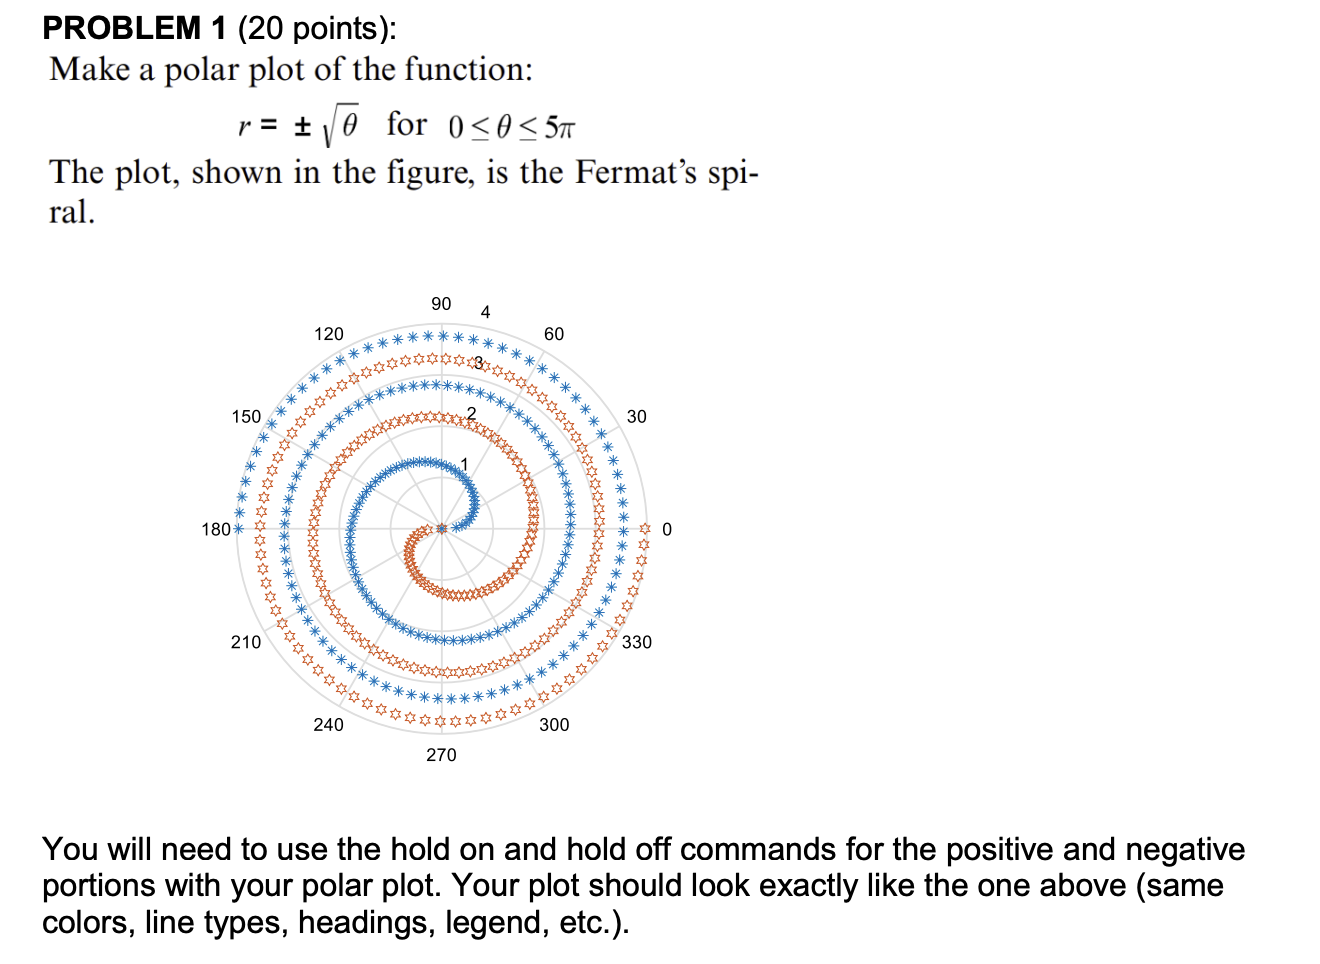
PROBLEM points:
Make a polar plot of the function:
for
The plot, shown in the figure, is the Fermat's spiral.
You will need to use the hold on and hold off commands for the positive and negative
portions with your polar plot. Your plot should look exactly like the one above same
colors, line types, headings, legend, etc.
Step by Step Solution
There are 3 Steps involved in it
1 Expert Approved Answer
Step: 1 Unlock

Question Has Been Solved by an Expert!
Get step-by-step solutions from verified subject matter experts
Step: 2 Unlock
Step: 3 Unlock