

Question: Problem 1 (5 pts each): From package MASS load the 'Boston' dataframe. The data headers are: crim: per capita crime rate by town. zn: proportion
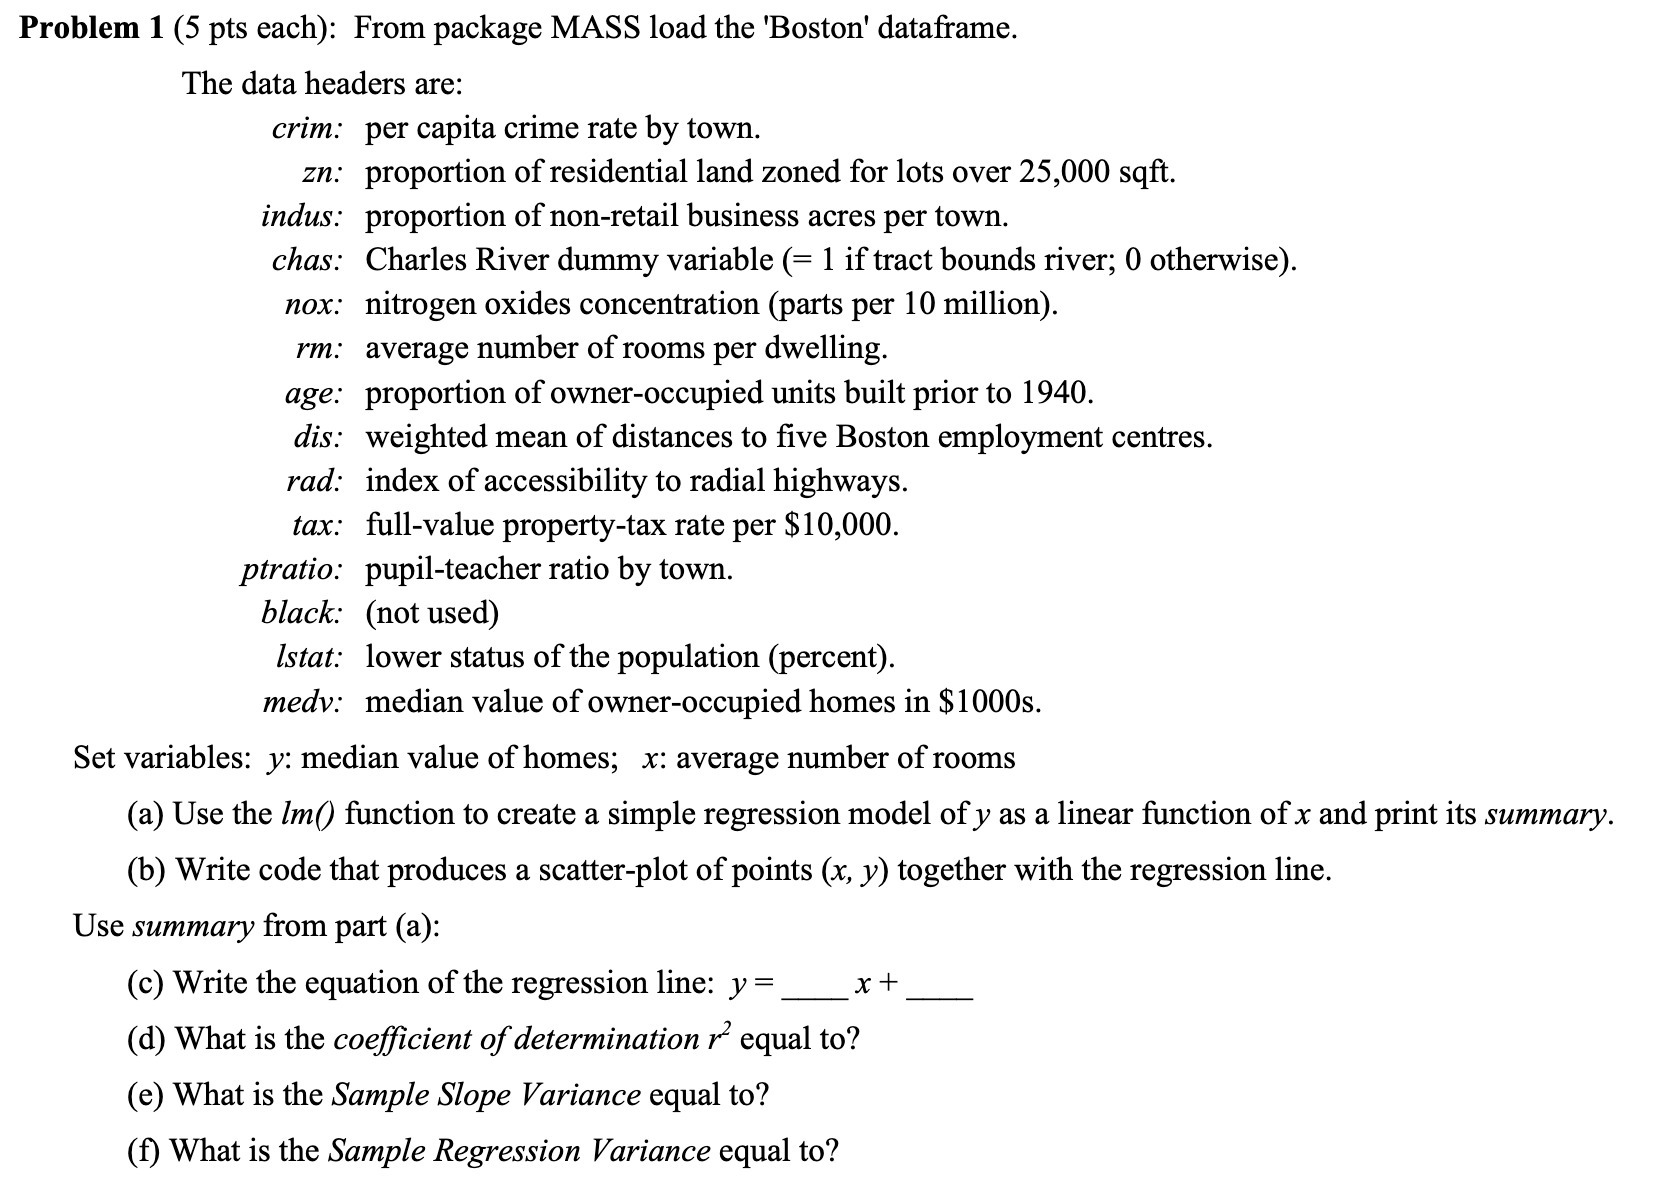

Problem 1 (5 pts each): From package MASS load the 'Boston' dataframe. The data headers are: crim: per capita crime rate by town. zn: proportion of residential land zoned for lots over 25,000 sqft. indus: proportion of non-retail business acres per town. chas: Charles River dummy variable (= 1 if tract bounds river; 0 otherwise). nox: nitrogen oxides concentration (parts per 10 million). rm: average number of rooms per dwelling. age: proportion of owner-occupied units built prior to 1940. dis: weighted mean of distances to five Boston employment centres. rad: index of accessibility to radial highways. tax: full-value property-tax rate per $10,000. ptratio: pupil-teacher ratio by town. black: (not used) Istat: lower status of the population (percent). medv: median value of owner-occupied homes in $1000s. Set variables: y: median value of homes; x: average number of rooms (a) Use the Im() function to create a simple regression model of y as a linear function of x and print its summary. (b) Write code that produces a scatter-plot of points (x, y) together with the regression line. Use summary from part (a): (c) Write the equation of the regression line: y = * + (d) What is the coefficient of determination r equal to? (e) What is the Sample Slope Variance equal to? (f) What is the Sample Regression Variance equal to
Step by Step Solution
There are 3 Steps involved in it

Get step-by-step solutions from verified subject matter experts