

Question: Problem 1 : As a quality inspector at GE , your primary job is to monitor the average life of a line of lamp bulbs.
Problem :
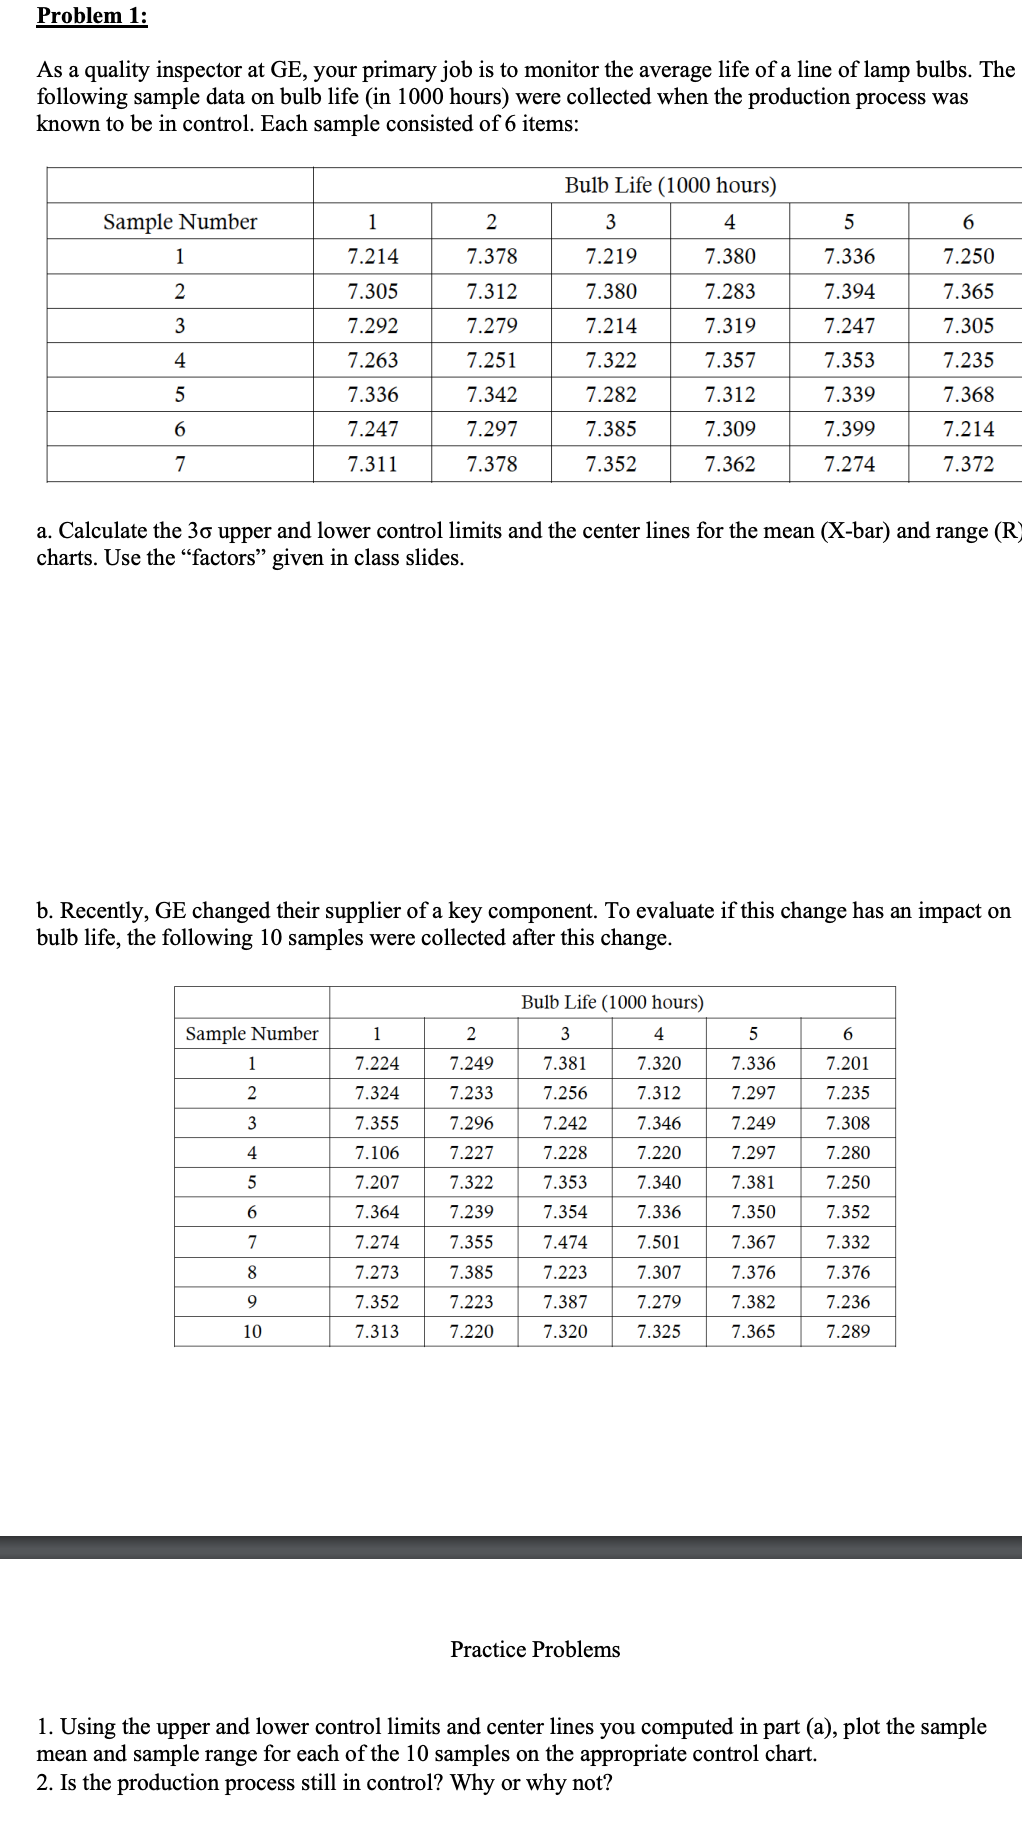
As a quality inspector at GE your primary job is to monitor the average life of a line of lamp bulbs. The
following sample data on bulb life in hours were collected when the production process was
known to be in control. Each sample consisted of items:
a Calculate the upper and lower control limits and the center lines for the mean Xbar and range R
charts. Use the "factors" given in class slides.
b Recently, GE changed their supplier of a key component. To evaluate if this change has an impact on
bulb life, the following samples were collected after this change.
Using the upper and lower control limits and center lines you computed in part a plot the sample
mean and sample range for each of the samples on the appropriate control chart.
Is the production process still in control? Why or why not?
Step by Step Solution
There are 3 Steps involved in it
1 Expert Approved Answer
Step: 1 Unlock

Question Has Been Solved by an Expert!
Get step-by-step solutions from verified subject matter experts
Step: 2 Unlock
Step: 3 Unlock