

Question: Problem 1 - Average Riders Per Line (Plese using Python and careful follow the instruction below:) If you are not following the rubrics, you will
Problem 1 - Average Riders Per Line (Plese using Python and careful follow the instruction below:)
If you are not following the rubrics, you will NOT receive a thumb up.
The instruction for this question might be a bit long, but I think you can solve it around 20 minutes!
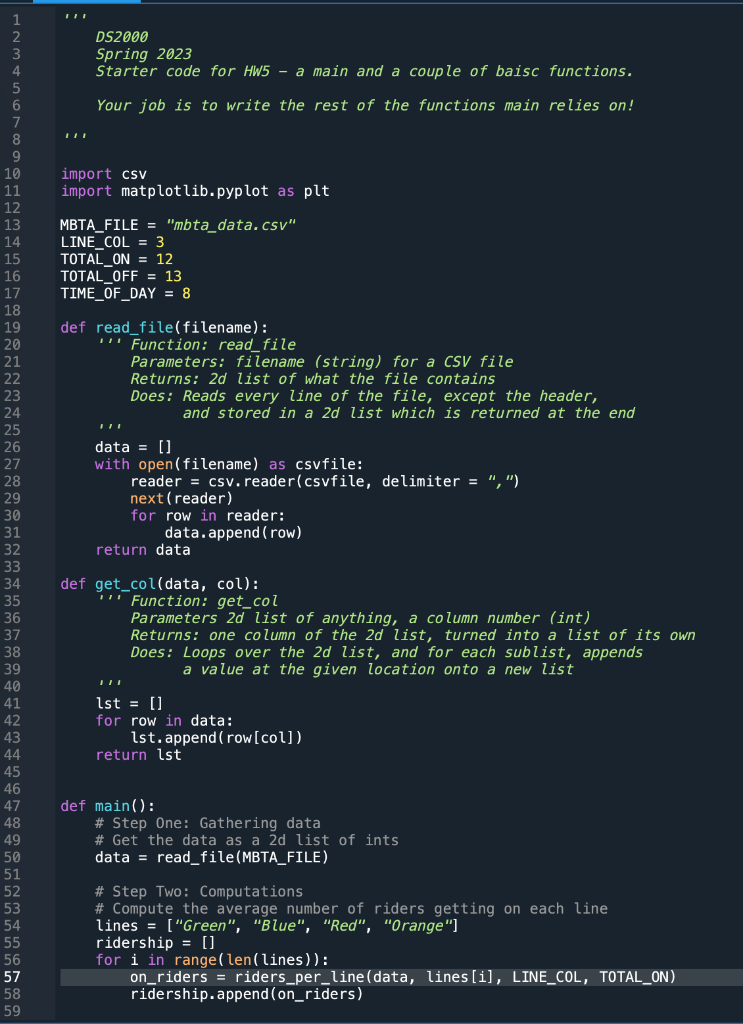
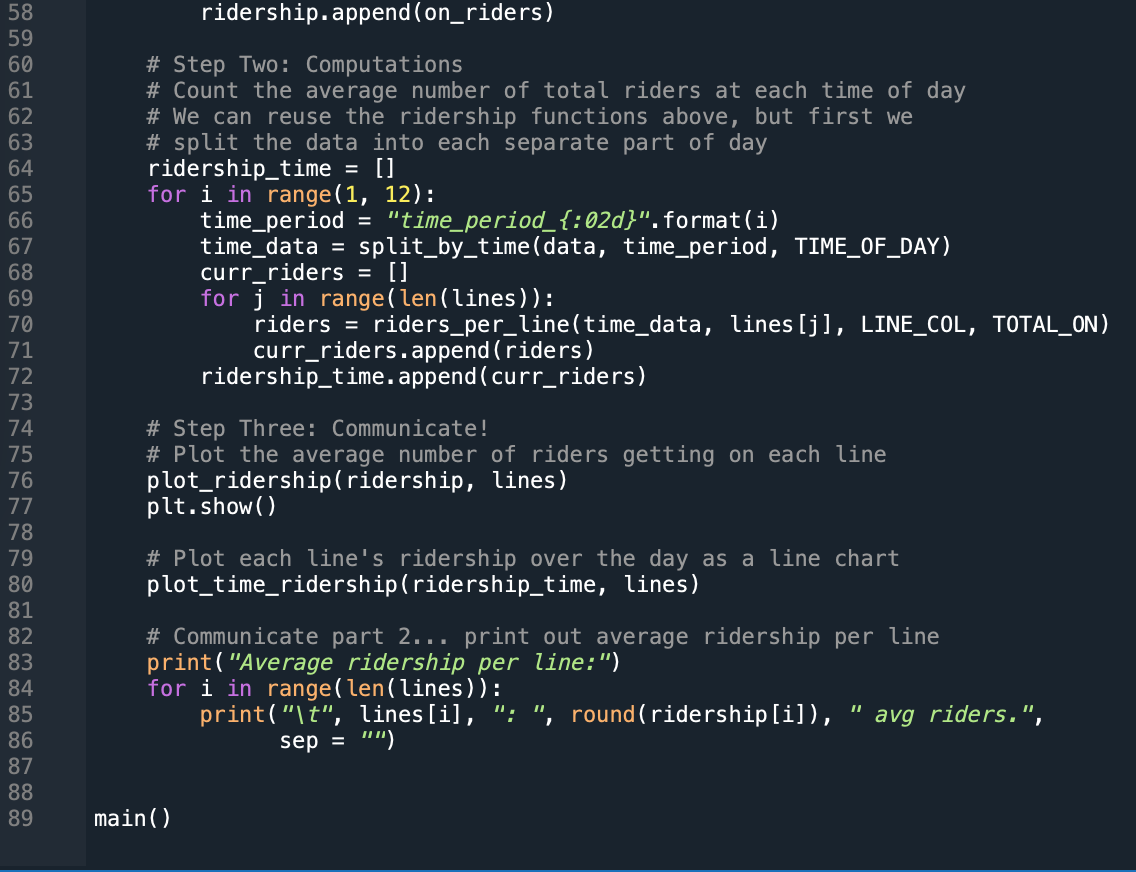
Here is the Set-up for this question:
You can just easily copy paste all the setup codes and add new code in it :)
Here is the instruction of the question:
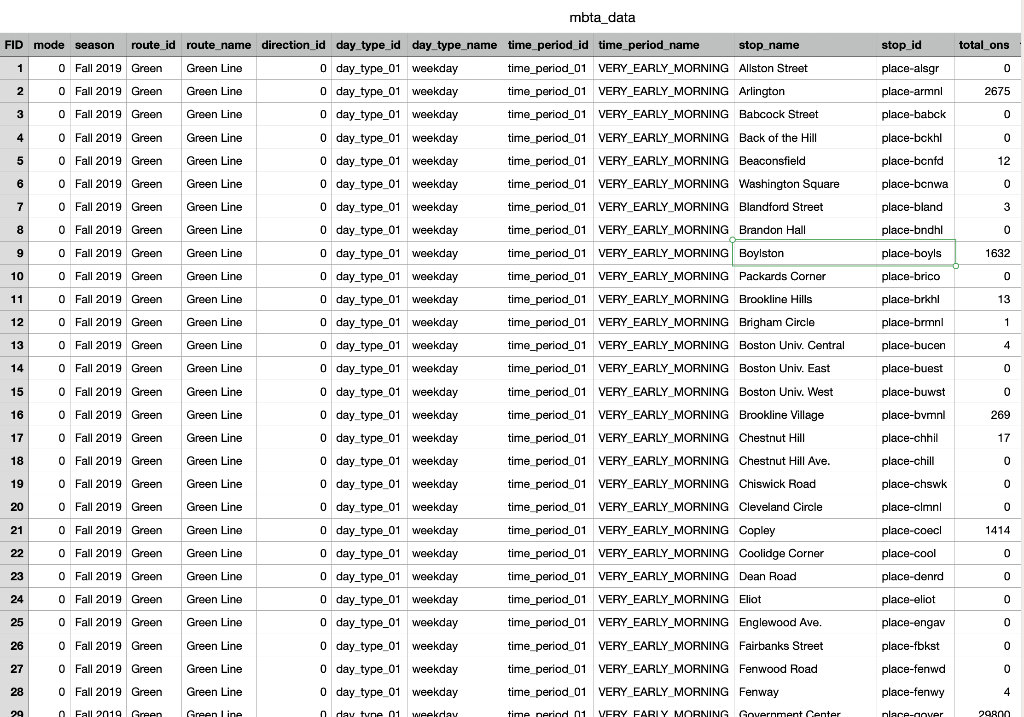
***References for the csv file:
Thank you :-)
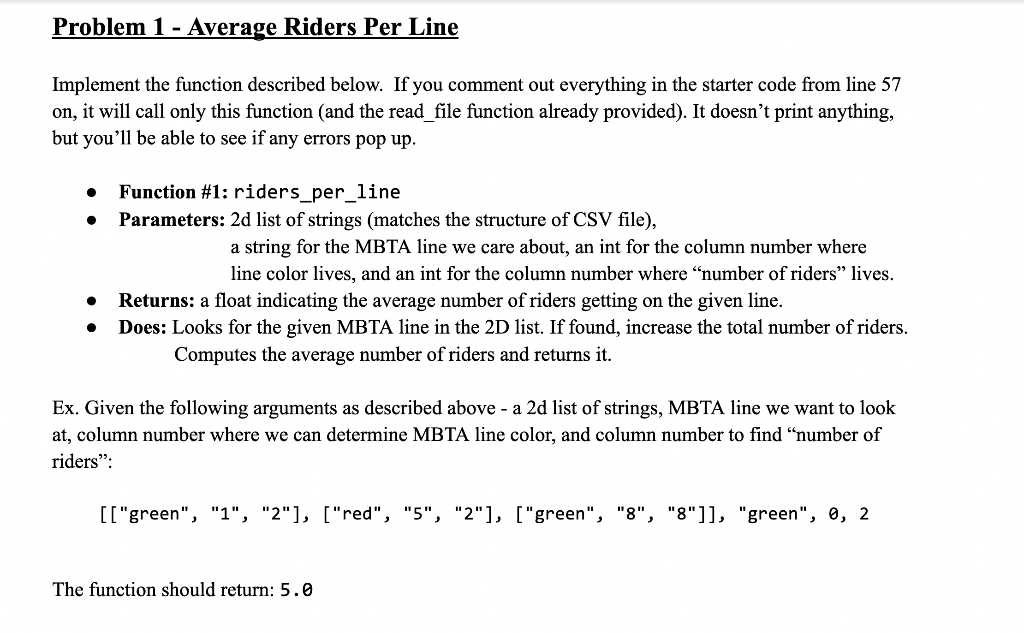
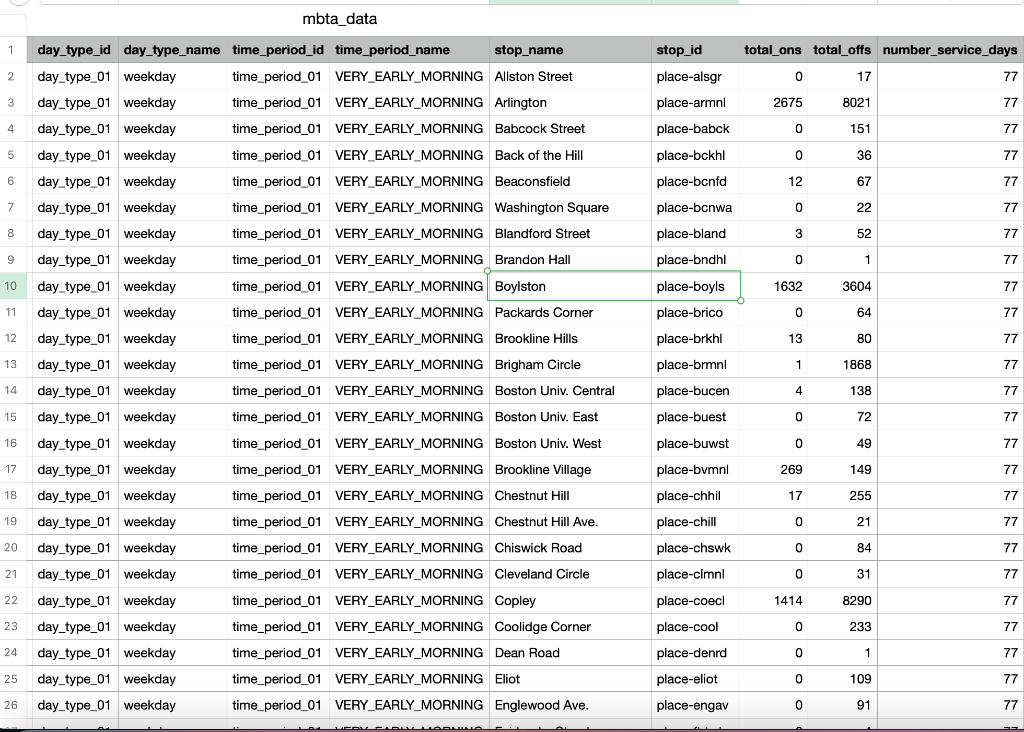
Implement the function described below. If you comment out everything in the starter code from line 57 on, it will call only this function (and the read_file function already provided). It doesn't print anything, but you'll be able to see if any errors pop up. - Function \#1: riders_per_line - Parameters: 2d list of strings (matches the structure of CSV file), a string for the MBTA line we care about, an int for the column number where line color lives, and an int for the column number where "number of riders" lives. - Returns: a float indicating the average number of riders getting on the given line. - Does: Looks for the given MBTA line in the 2D list. If found, increase the total number of riders. Computes the average number of riders and returns it. Ex. Given the following arguments as described above - a 2d list of strings, MBTA line we want to look at, column number where we can determine MBTA line color, and column number to find "number of riders": [["green", "1", "2"], ["red", "5", "2"], ["green", "8", "8"]], "green", 0, 2 The function should return: 5.0 mbta_data mbta_data
Step by Step Solution
There are 3 Steps involved in it

Get step-by-step solutions from verified subject matter experts