

Question: Problem 1. Consider process with target 15 and proces standard deviation 8. Recall that the control limits for an EWMA control chart depend on the
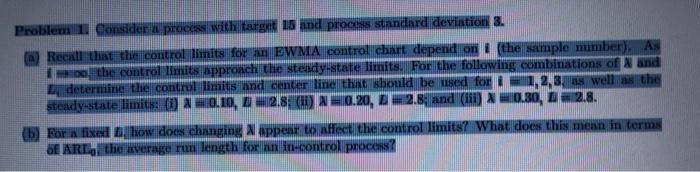
Problem 1. Consider process with target 15 and proces standard deviation 8. Recall that the control limits for an EWMA control chart depend on the sample number). A the control limits approach the steady-state limits. For the following combinations of Xand determine the control limits and center line that should be used for 1,2,3 as well as the steady-state limits: 1 20.10,4 = 12.8 (U) N=0.20, L = 2.8; and (11) 40.80, 1-2.8. (b) For a fixed how does changing appear to affect the control limits? What does this mean in terms of ART the average length for in-control process? Problem 1. Consider process with target 15 and proces standard deviation 8. Recall that the control limits for an EWMA control chart depend on the sample number). A the control limits approach the steady-state limits. For the following combinations of Xand determine the control limits and center line that should be used for 1,2,3 as well as the steady-state limits: 1 20.10,4 = 12.8 (U) N=0.20, L = 2.8; and (11) 40.80, 1-2.8. (b) For a fixed how does changing appear to affect the control limits? What does this mean in terms of ART the average length for in-control process
Step by Step Solution
There are 3 Steps involved in it

Get step-by-step solutions from verified subject matter experts