

Question: Consider the influenza data in Exercise 15-84. Use μ =160 and Ï = 2. (a) Construct an EWMA control chart with λ = 0.1. Use
(a) Construct an EWMA control chart with λ = 0.1. Use L = 2.81. Does the process appear to be in control?
(b) Construct an EWMA control chart with λ = 0.5. Use L = 3.07. Compare your results to those in part (a).
Exercise 15-84
The number of influenza patients (in thousands) visiting hospitals weekly is shown in the following table. Suppose that the standard deviation is σ = 2 and the target value is 160.
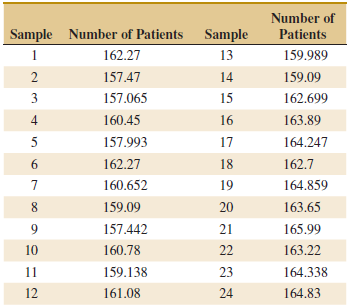
Number of Sample Number of Patients Sample Patients 162.27 1 13 159.989 157.47 14 159.09 3 157.065 15 162.699 160.45 16 163.89 157.993 17 164.247 6. 162.27 18 162.7 164.859 160.652 19 8. 159.09 20 163.65 157.442 21 165.99 10 160.78 22 163.22 11 159.138 23 164.338 12 161.08 24 164.83
Step by Step Solution
3.32 Rating (167 Votes )
There are 3 Steps involved in it
a lambda01 L281 sigma2 UCL 16129 LCL 15871 the chart signa... View full answer

Get step-by-step solutions from verified subject matter experts