

Question: Problem 1: (i). Create an m-fille mylagrange.m as described below: function p=mylagrange(x0,70,x) N = length(x0) compute L_i(x), for i=1,2,...,N compute p = sum_{i=1:N} yo(i) L_i(x)
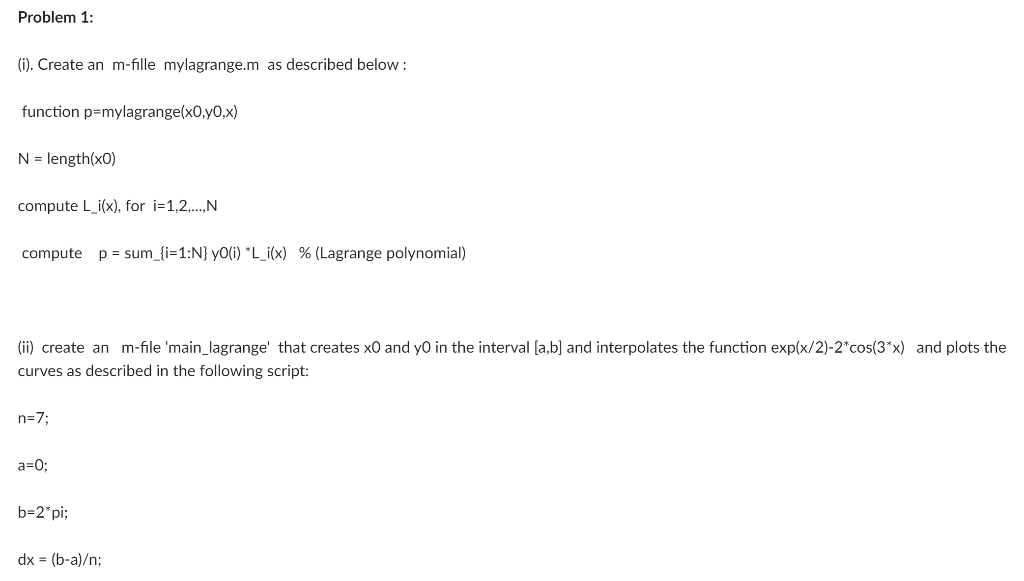
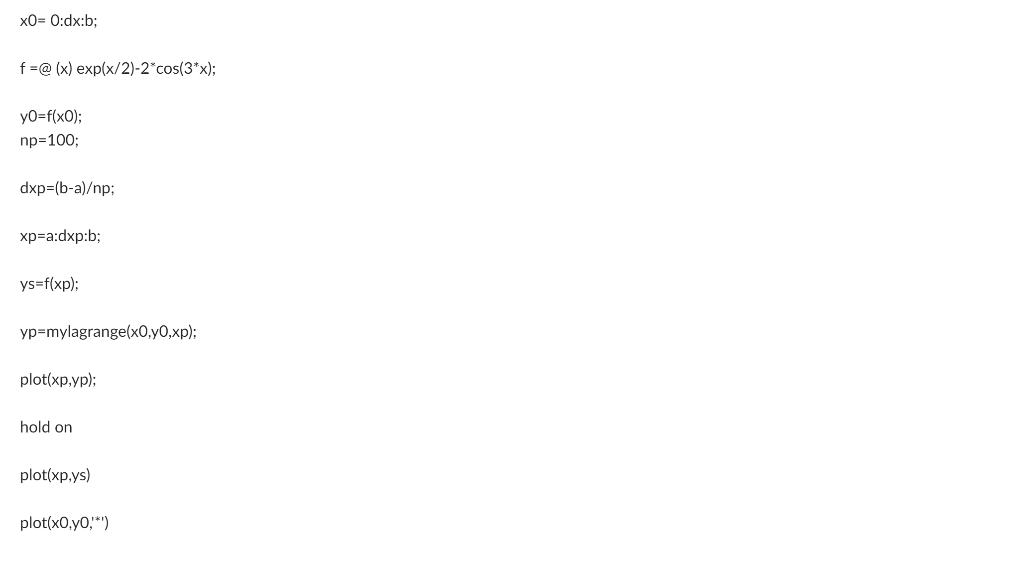

Problem 1: (i). Create an m-fille mylagrange.m as described below: function p=mylagrange(x0,70,x) N = length(x0) compute L_i(x), for i=1,2,...,N compute p = sum_{i=1:N} yo(i) "L_i(x) % (Lagrange polynomial) (ii) create an m-file 'main_lagrange' that creates XO and yo in the interval (a,b) and interpolates the function exp(x/2)-2*cos(3*x) and plots the curves as described in the following script: n=7; a=0; b=2*pi; dx = (b-a); XO=0:dx:b; f=@(x) exp(x/2)-2* cos(3*x); yO=f(x0); np=100; dxp=(b-a)p; xp=a:dxp:b; ys=f(xp); yp=mylagrange(x0,70,xp); plot(xp,yp); hold on plot(xp.ys) plot(x0,70,*) (iii) Print your results. (iv) Are your results correct? Explain why or why not? Problem 1: (i). Create an m-fille mylagrange.m as described below: function p=mylagrange(x0,70,x) N = length(x0) compute L_i(x), for i=1,2,...,N compute p = sum_{i=1:N} yo(i) "L_i(x) % (Lagrange polynomial) (ii) create an m-file 'main_lagrange' that creates XO and yo in the interval (a,b) and interpolates the function exp(x/2)-2*cos(3*x) and plots the curves as described in the following script: n=7; a=0; b=2*pi; dx = (b-a); XO=0:dx:b; f=@(x) exp(x/2)-2* cos(3*x); yO=f(x0); np=100; dxp=(b-a)p; xp=a:dxp:b; ys=f(xp); yp=mylagrange(x0,70,xp); plot(xp,yp); hold on plot(xp.ys) plot(x0,70,*) (iii) Print your results. (iv) Are your results correct? Explain why or why not
Step by Step Solution
There are 3 Steps involved in it

Get step-by-step solutions from verified subject matter experts