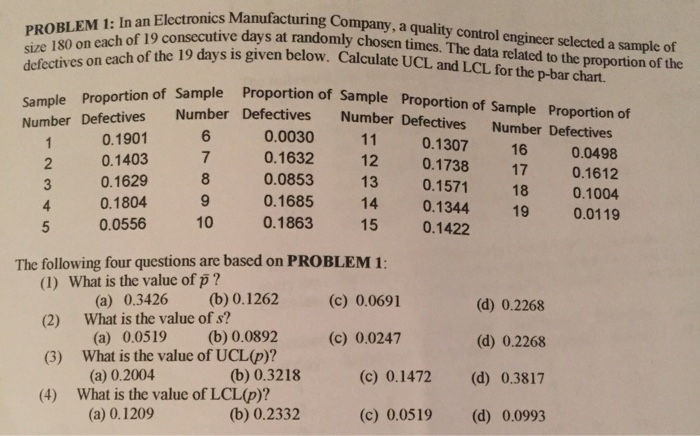
Question: PROBLEM 1: In an Electronics Manufacturing Company, a quality control engineer selected a sample of defectives on each of the 19 days is given below.

PROBLEM 1: In an Electronics Manufacturing
PROBLEM 1: In an Electronics Manufacturing Company, a quality control engineer selected a sample of defectives on each of the 19 days is given below. Calculate UCL and LCL for the p-bar chart. size 180 on each of 19 consecutive days at randomly chosen times. The data related to the proportion of the Sample Proportion of Sample Proportion of Sample Proportion of Sample Proportion of Number Defectives Number Defectives 1 0.1901 6 0.0030 2 0.1403 7 0.1632 3 0.1629 8 0.0853 4 0.1804 9 0.1685 5 0.0556 10 0.1863 Number Defectives 11 0.1307 12 0.1738 13 0.1571 14 0.1344 15 0.1422 Number Defectives 16 0.0498 17 0.1612 18 0.1004 19 0.0119 (d) 0.2268 The following four questions are based on PROBLEM 1: (1) What is the value of p? (a) 0.3426 (b) 0.1262 (c) 0.0691 (2) What is the value of s? (a) 0.0519 (b) 0.0892 (c) 0.0247 (3) What is the value of UCL (p)? (a) 0.2004 (b) 0.3218 (c) 0.1472 (4) What is the value of LCL(p)? (a) 0.1209 (b) 0.2332 (c) 0.0519 (d) 0.2268 (d) 0.3817 (d) 0.0993

Step by Step Solution

There are 3 Steps involved in it

1 Expert Approved Answer
Step: 1 Unlock blur-text-image
Question Has Been Solved by an Expert!

Get step-by-step solutions from verified subject matter experts

Step: 2 Unlock
Step: 3 Unlock

Students Have Also Explored These Related General Management Questions!