

Question: Sample Proportion of Sample PROBLEM 1: In an Electronics Manufacturing Company, a quality control engineer selected a sample of size 180 on each of
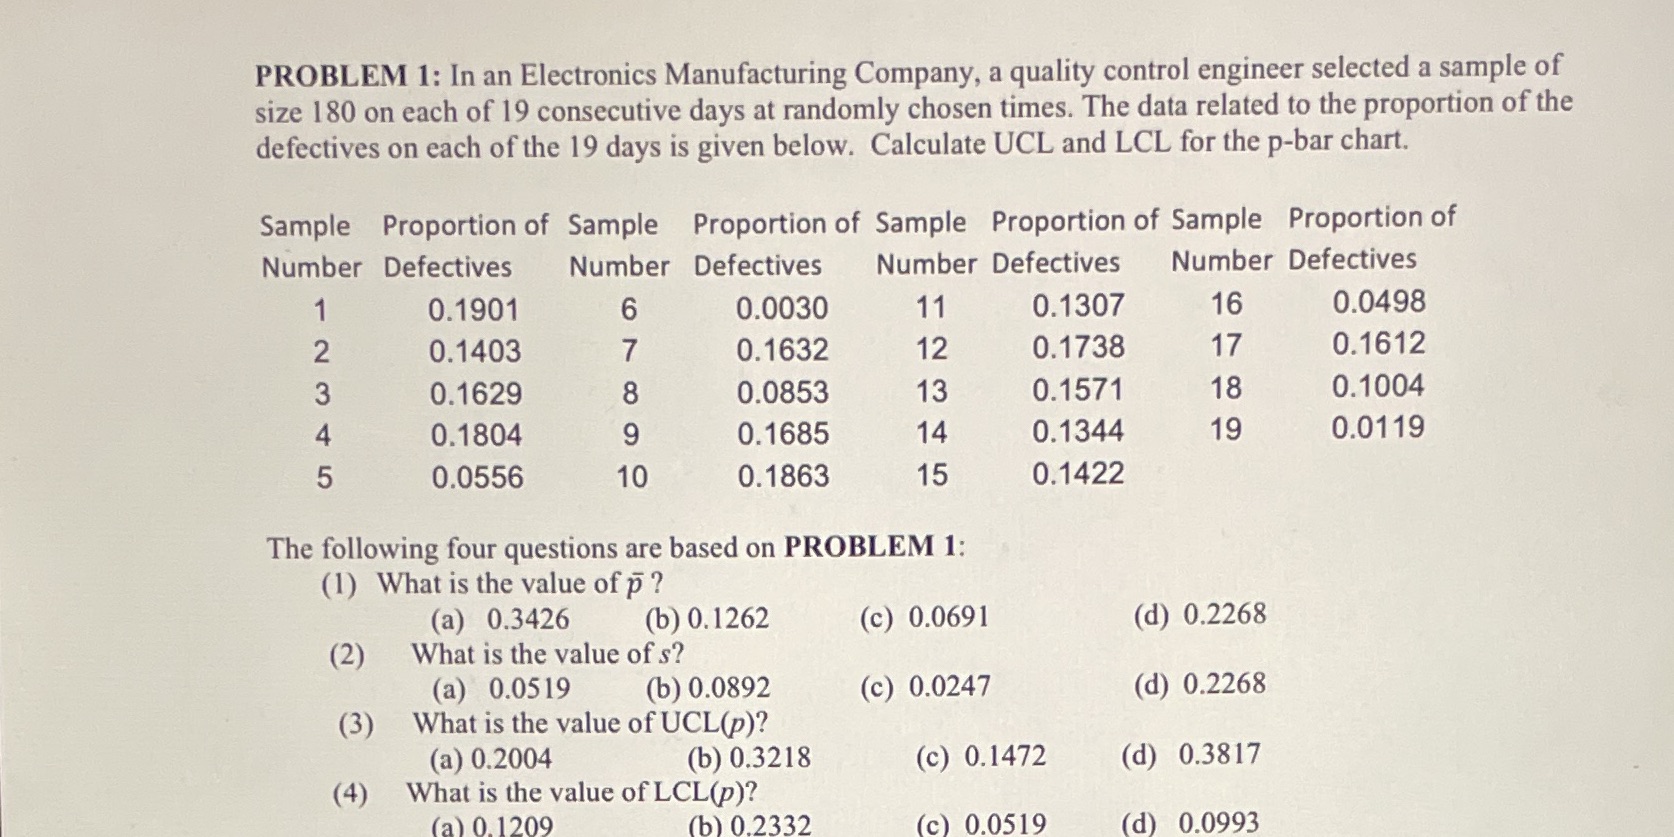
Sample Proportion of Sample PROBLEM 1: In an Electronics Manufacturing Company, a quality control engineer selected a sample of size 180 on each of 19 consecutive days at randomly chosen times. The data related to the proportion of the defectives on each of the 19 days is given below. Calculate UCL and LCL for the p-bar chart. Proportion of Sample Proportion of Sample Proportion of Number Defectives Number Defectives Number Defectives Number Defectives 1 0.1901 6 0.0030 11 0.1307 16 0.0498 2 0.1403 7 0.1632 12 0.1738 17 0.1612 3 0.1629 8 0.0853 13 0.1571 18 0.1004 4 0.1804 9 0.1685 14 0.1344 19 0.0119 5 0.0556 10 0.1863 15 0.1422 The following four questions are based on PROBLEM 1: (1) What is the value of p? (2) (a) 0.3426 (b) 0.1262 What is the value of s? (a) 0.0519 (c) 0.0691 (d) 0.2268 (b) 0.0892 (c) 0.0247 (d) 0.2268 (3) What is the value of UCL(p)? (4) (a) 0.2004 What is the value of LCL(p)? (b) 0.3218 (c) 0.1472 (d) 0.3817 (a) 0.1209 (b) 0.2332 (c) 0.0519 (d) 0.0993
Step by Step Solution
There are 3 Steps involved in it

Get step-by-step solutions from verified subject matter experts