

Question: Problem 1 In your fluids laboratory, you take a series of measurements of dynamic viscosity () of water at different temperatures and generate the following
Problem 1
In your fluids laboratory, you take a series of measurements of dynamic viscosity () of water at different temperatures and generate the following table of data:
T (C) 1 2 4 8 16 32
(10-3 Ns/m2) 1.708 1.641 1.610 1.413 1.102 0.750 Write a MATLAB M-file using the polyfit function to fit a quadratic regression equation to the data and to calculate the r2 value of the fit. Provide a printout of your M-file and a printout of the command window showing your results. Write down the best-fit quadratic equation and put a box around it.
Problem 2
Write a MATLAB M-file that uses the general least squares method ( a Zy ) to fit the following data with a multiple linear regression equation of the form y = a0 + a1x1 + a2x2: y x1 x2 15.0 0 0 18.1 1 1 12.5 1 2 25.4 2 1 20.7 2 2 35.1 3 1 29.7 3 2 45.4 4 1 40.2 4 2 The M-file should solve the normal equation based on Z for the model coefficienta , i.e. [ZTZ]{a }={ZT y }. Provide a printout of your M-file and a printout of the command window showing your results. Write down the best-fit equation and put a box around it. 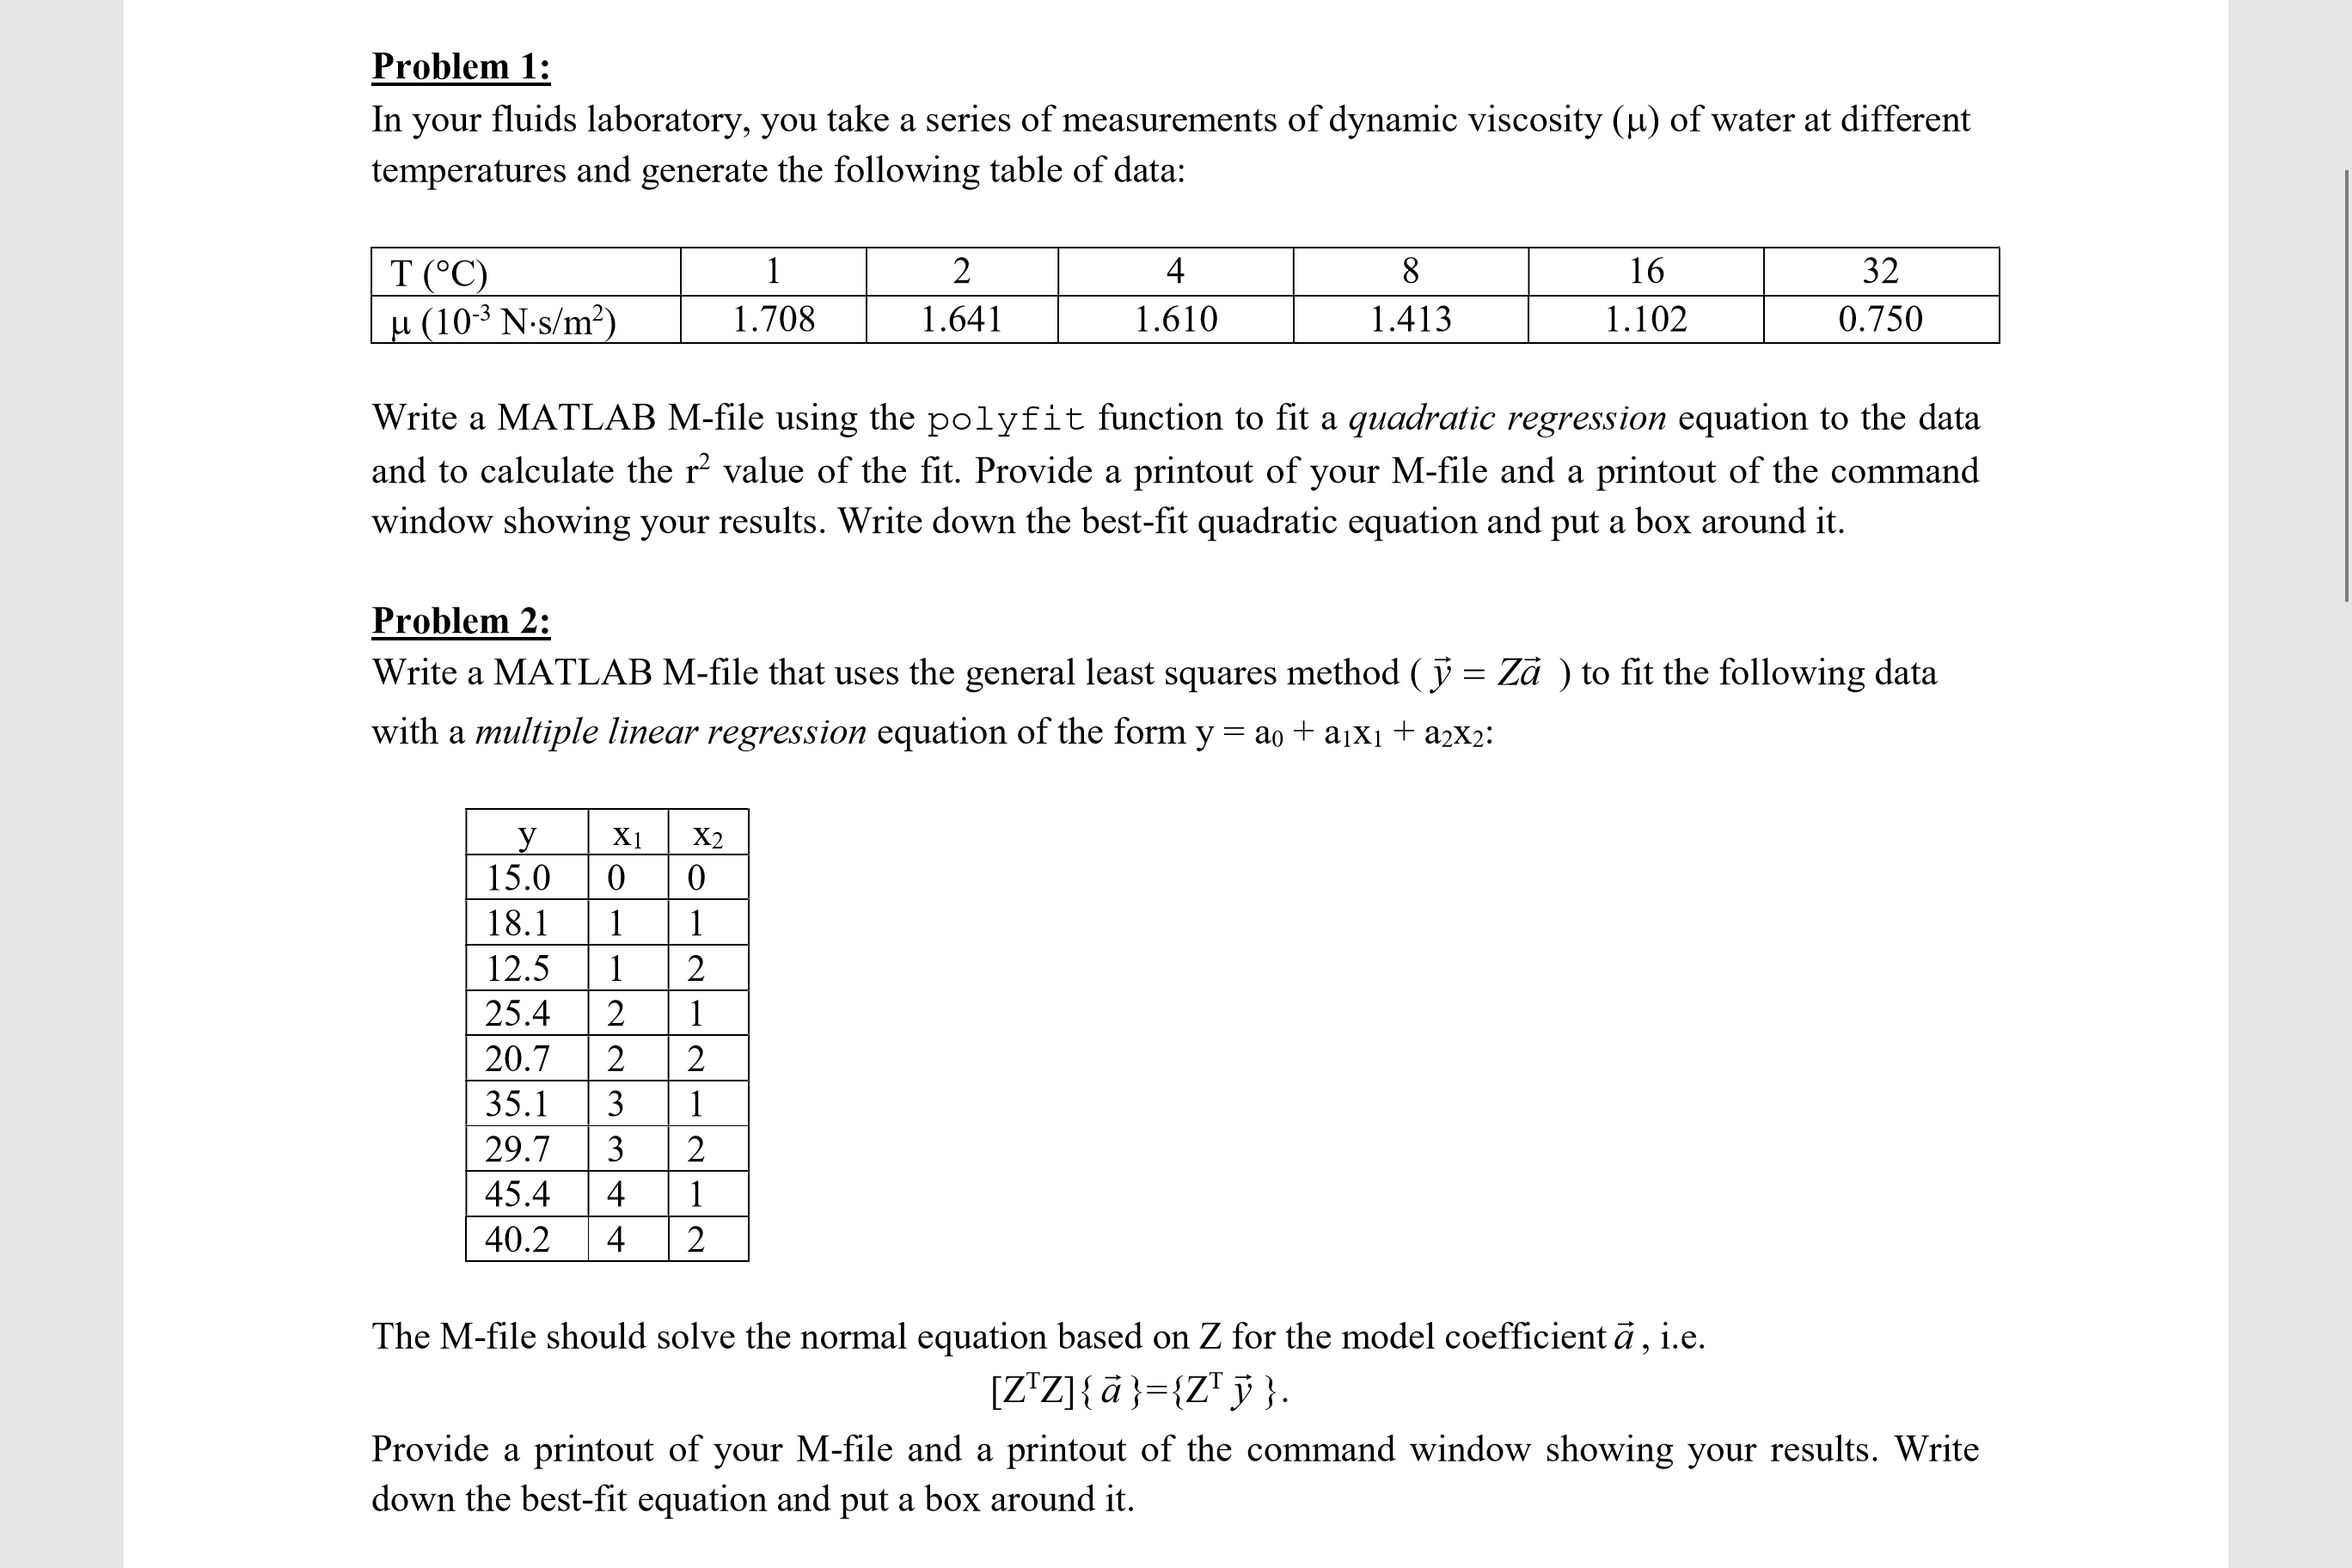
Problem 1: In your fluids laboratory, you take a series of measurements of dynamic viscosity() of water at different temperatures and generate the following table of data: 4 1.610 16 1.102 32 0.750 10-3 N-s/m 1.708 1.641 1.413 Write a MATLAB M-file using the polyfit function to fit a quadratic regression equation to the data and to calculate the r value of the fit. Provide a printout of your M-file and a printout of the command window showing your results. Write down the best-fit quadratic equation and put a box around it Problem 2: Write a MATLAB M-file that uses the general least squares method(y = Za ) to fit the following data with a multiple linear regression equation of the form y- ao +aiXi + a2X2: X1X2 15.000 18.11 1 12.51 2 25.4 21 20.72 2 35.1 31 29.73 2 45.4 41 40.2 4 2 The M-file should solve the normal equation based on Z for the model coefficient , i.e. Provide a printout of your M-file and a printout of the command window showing your results. Write down the best-fit equation and put a box around it
Step by Step Solution
There are 3 Steps involved in it

Get step-by-step solutions from verified subject matter experts