

Question: Problem 1 Run and explain what the following Matlab program does, what are the two signals consisting of? clear all close all sig = zeros(181,1);
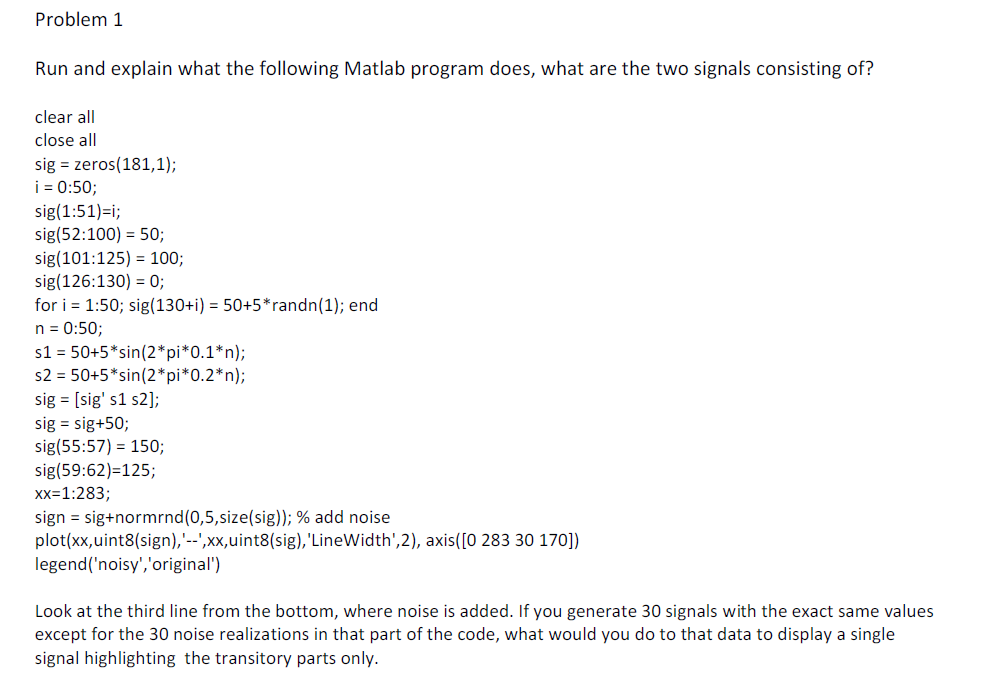
Problem 1 Run and explain what the following Matlab program does, what are the two signals consisting of? clear all close all sig = zeros(181,1); i = 0:50; sig(1:51)=i; sig(52:100) = 50; sig(101:125) = 100; sig(126:130) = 0; for i = 1:50; sig(130+i) = 50+5*randn(1); end n = 0:50; s1 = 50+5* sin(2*pi*0.1*n); s2 = 50+5* sin(2*pi*0.2*n); sig = [sig' s1 s2); sig = sig+50; sig(55:57) = 150; sig(59:62)=125; xx=1:283; sign = sig+normrnd(0,5,size(sig)); % add noise plot(xx, uint8(sign),'--',xx,uint8(sig), 'LineWidth',2), axis([0 283 30 170]) legend('noisy','original") Look at the third line from the bottom, where noise is added. If you generate 30 signals with the exact same values except for the 30 noise realizations in that part of the code, what would you do to that data to display a single signal highlighting the transitory parts only. Problem 1 Run and explain what the following Matlab program does, what are the two signals consisting of? clear all close all sig = zeros(181,1); i = 0:50; sig(1:51)=i; sig(52:100) = 50; sig(101:125) = 100; sig(126:130) = 0; for i = 1:50; sig(130+i) = 50+5*randn(1); end n = 0:50; s1 = 50+5* sin(2*pi*0.1*n); s2 = 50+5* sin(2*pi*0.2*n); sig = [sig' s1 s2); sig = sig+50; sig(55:57) = 150; sig(59:62)=125; xx=1:283; sign = sig+normrnd(0,5,size(sig)); % add noise plot(xx, uint8(sign),'--',xx,uint8(sig), 'LineWidth',2), axis([0 283 30 170]) legend('noisy','original") Look at the third line from the bottom, where noise is added. If you generate 30 signals with the exact same values except for the 30 noise realizations in that part of the code, what would you do to that data to display a single signal highlighting the transitory parts only
Step by Step Solution
There are 3 Steps involved in it

Get step-by-step solutions from verified subject matter experts