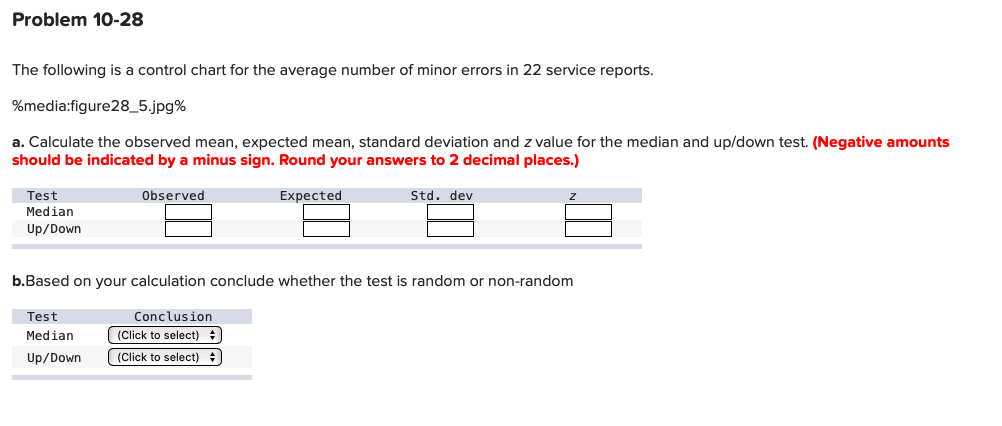
Question: Problem 10-28 The following is a control chart for the average number of minor errors in 22 service reports. %media:figure 28_5.jpg% a. Calculate the observed

Problem 10-28 The following is a control chart

Problem 10-28 The following is a control chart for the average number of minor errors in 22 service reports. %media:figure 28_5.jpg% a. Calculate the observed mean, expected mean, standard deviation and z value for the median and up/down test. (Negative amounts should be indicated by a minus sign. Round your answers to 2 decimal places.) Observed Expected Std. dev Test Median Up/Down b.Based on your calculation conclude whether the test is random or non-random Test Median Up/Down Conclusion (Click to select) ((Click to select) ) ) Problem 10-28 The following is a control chart for the average number of minor errors in 22 service reports. %media:figure 28_5.jpg% a. Calculate the observed mean, expected mean, standard deviation and z value for the median and up/down test. (Negative amounts should be indicated by a minus sign. Round your answers to 2 decimal places.) Observed Expected Std. dev Test Median Up/Down b.Based on your calculation conclude whether the test is random or non-random Test Median Up/Down Conclusion (Click to select) ((Click to select) ) )

Step by Step Solution

There are 3 Steps involved in it

1 Expert Approved Answer
Step: 1 Unlock blur-text-image
Question Has Been Solved by an Expert!

Get step-by-step solutions from verified subject matter experts

Step: 2 Unlock
Step: 3 Unlock

Students Have Also Explored These Related General Management Questions!