

Question: Problem 14-1A a, bi Here are comparative statement data for Duke Company and Lord Company, two competitors. All balance sheet data are as of December
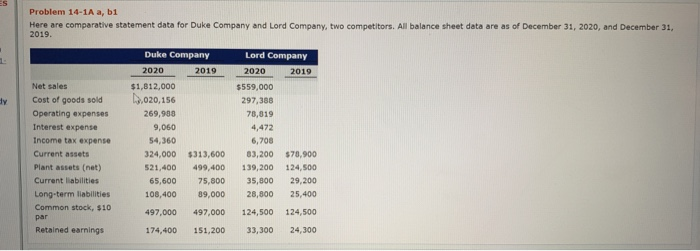
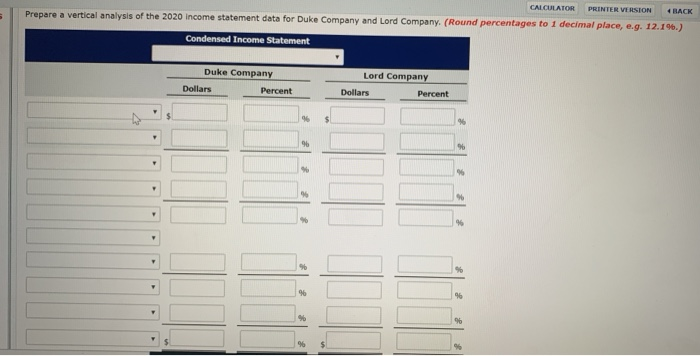

Problem 14-1A a, bi Here are comparative statement data for Duke Company and Lord Company, two competitors. All balance sheet data are as of December 31, 2020, and December 31, 2019. Duke Company Lord Company 2020 2019 2020 2019 Net sales Cost of goods sold Operating expenses Interest expense Income tax expense Current assets Plant assets (net) Current liabilities Long-term liabilities Common stock, $10 $1,012,000 ,020,156 269,900 9,060 54,360 324,000 521,400 65,600 108,400 497,000 174,400 $313,600 499,400 75,000 89,000 497,000 151,200 $559,000 297,388 78,819 4,472 6,708 83,200 139,200 35,800 28,800 124,500 33,300 $70,900 124,500 29,200 25,400 124,500 24,300 Retained earnings CALCULATOR PRINTER VERSION BACK Prepare a vertical analysis of the 2020 income statement data for Duke Company and Lord Company. (Round percentages to 1 decimal place, e.g. 12.196.) Condensed Income Statement Lord Company Duke Company Dollars Percent Dollars
Step by Step Solution
There are 3 Steps involved in it

Get step-by-step solutions from verified subject matter experts