

Question: Problem 18-01A a, b1 Here are comparative statement data for Duke Company and Lord Company, two competitors. All balance sheet data are as of December
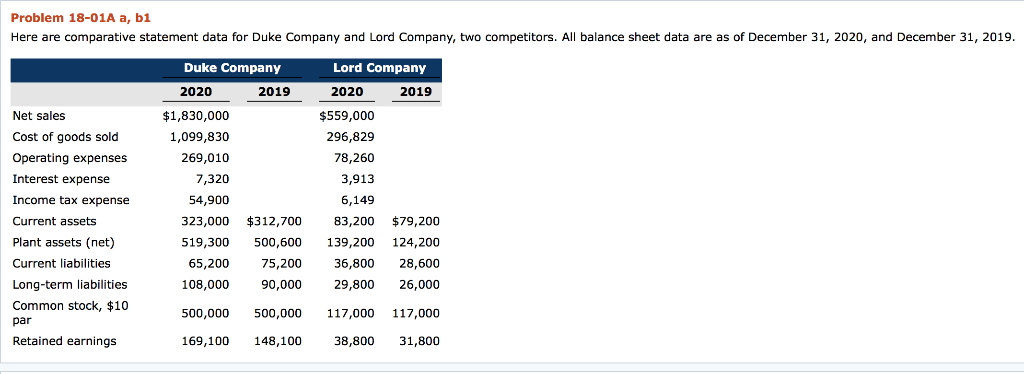
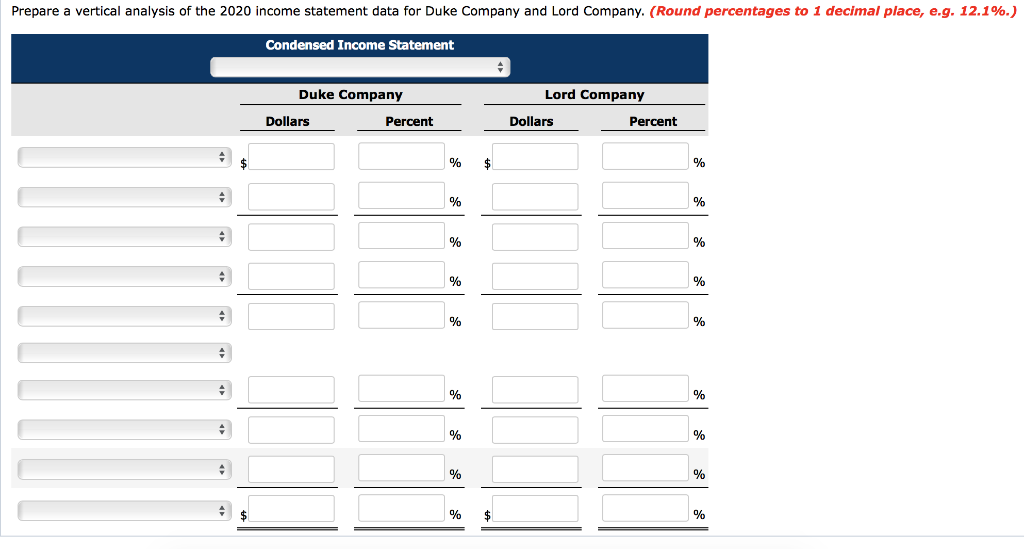
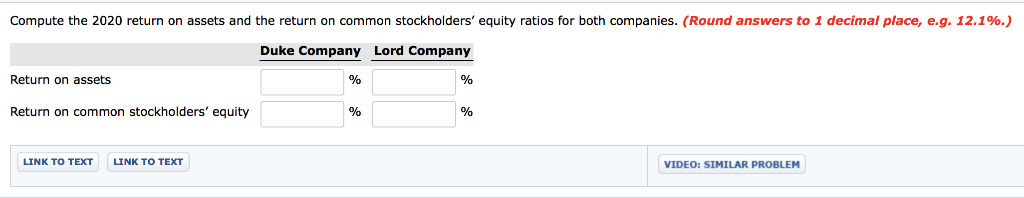
Problem 18-01A a, b1 Here are comparative statement data for Duke Company and Lord Company, two competitors. All balance sheet data are as of December 31, 2020, and December 31, 2019 Duke Company Lord Company 2020 2019 2020 2019 $1,830,000 1,099,830 $559,000 296,829 78,260 3,913 6,149 Net sales Cost of goods sold Operating expenses Interest expense Income tax expense Current assets Plant assets (net) Current liabilities Long-term liabilities Common stock, $10 par Retained earnings 269,010 7,320 54,900 323,000 $312,700 83,200 $79,200 519,300 500,600 139,200 124,200 36,800 28,600 29,800 26,000 500,000 500,000 117,000 117,000 38,800 31,800 65,200 108,000 75,200 90,000 169,100 148,100 Prepare a vertical analysis of the 2020 income statement data for Duke Company and Lord Company. (Round percentages to 1 decimal place, e.g. 12.1%.) Condensed Income Statement Duke Company Lord Company Dollars Percent Dollars Percent Compute the 2020 return on assets and the return on common stockholders' equity ratios or both companies. Round as we stol decima place e 12.1%, Duke Company Lord Company Return on assets Return on common stockholders' equity LINK TO TEXT LINK TO TEXT VIDEO: SIMILAR
Step by Step Solution
There are 3 Steps involved in it

Get step-by-step solutions from verified subject matter experts