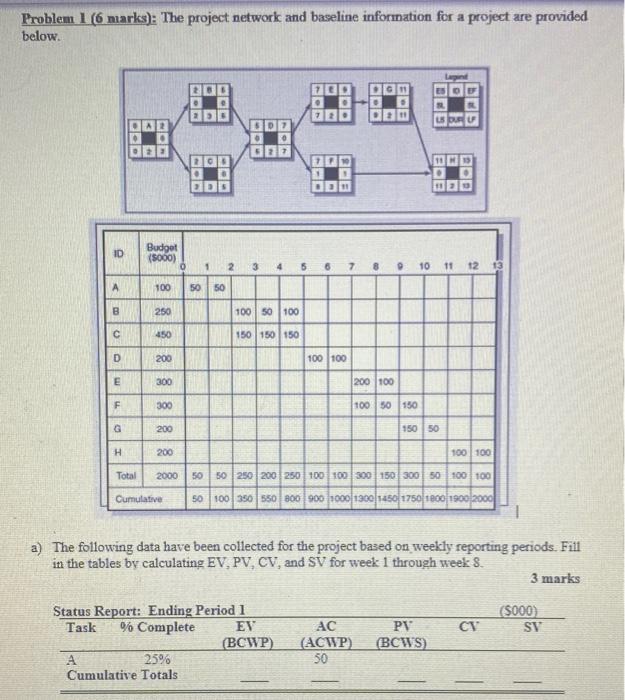
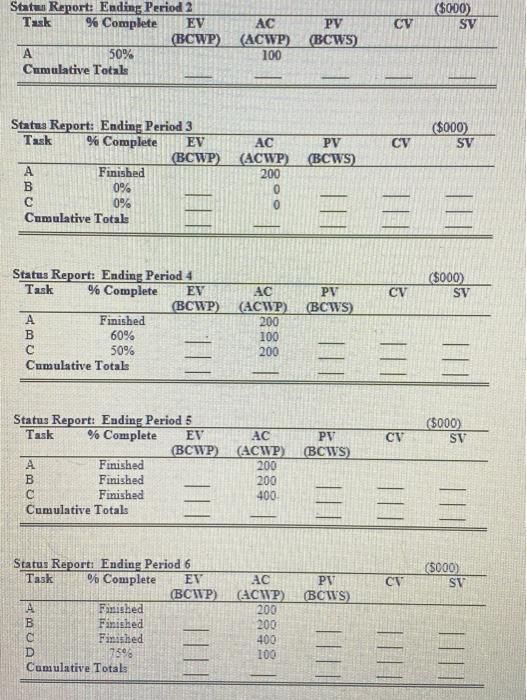
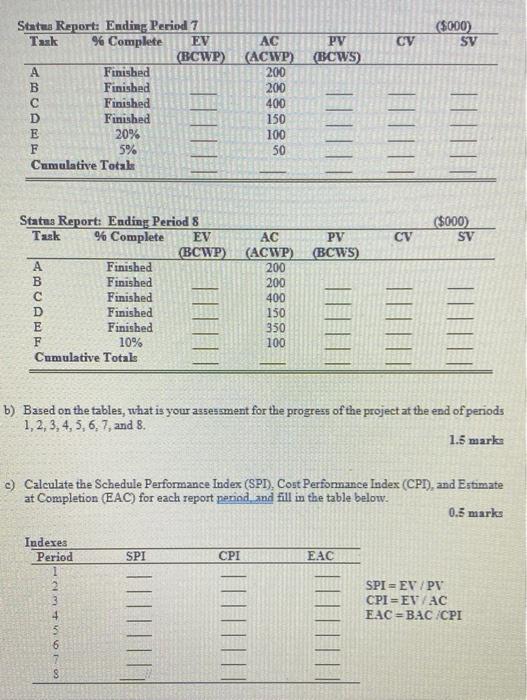
Question: Problem 1(6 miarks): The project network and baseline information for a project are provided below TED DO DOE SRO DE suru QAD JEDE . o

Problem 1(6 miarks): The project network and
Problem 1(6 miarks): The project network and baseline information for a project are provided below TED DO DOE SRO DE suru QAD JEDE . o GE Da El TIF . . DDD BOE . ID Budget (5000) 0 1 2 3 4 ON 7 8 10 11 12 13 100 50 50 B 250 100 50 100 150 150 150 c 450 200 mo 300 100/100 200 100 100 50 150 F 300 G 200 150 50 H 200 100 100 Total 2000 50 50 250 200 250 100 100 300 150 300 50 100 100 50 100 350 150 800 900 1000 13001450 1750 1000 1900 2000 Cumulative a) The following data have been collected for the project based on weekly reporting periods. Fill in the tables by calculating EV, PV, CV, and SV for week 1 through week 8. 3 marks (5000) SV CV Status Report: Ending Period 1 Task % Complete EV (BCWP) A 25% Cumulative Totals AC (ACWP) 50 PV BCWS) ($000) SV CV Status Report: Ending Period 2 Task % Complete EV (BCWP) A 50% Cumulative Total AC PY (ACWP) (BCWS) 100 ($000) SV CV Status Report: Ending Period 3 Task % Complete EV (BCWP) A Finished B 0% 0% Cumulative Total AC PV (ACWP) (BCWS) 200 0 0 = ($000) SV CV PV (BCWS) Status Report: Ending Period 4 Task % Complete EV (BCWP) A Finished B 60% 50% Cumulative Totals AC (ACWP) 200 100 200 ||| |||| (5000) SV CV PV (BCWS) Status Report: Ending Period 5 Task % Complete EV AC (BCWP) (ACWP) A Finished 200 B Finished 200 Finished 400 Cumulative Totals (5000) SV CV PT (BCWS) Status Report: Ending Period 6 Task % Complete EV (BCWP) A Fanished B Finished Finished D 7508 Cumulative Totals AC (ACWP) 203 200 400 100 (5000) SV CV PV (BCWS) 200 Status Report: Ending Period 7 Task % Complete EV AC (BCWP) (ACWP) Finished B Finished 200 Finished 400 Finished 150 20% 100 F 5% 50 Cumulative Total ($000) SV CV Status Report: Ending Period 8 Task % Complete EV AC PV (BCWP) (ACWP) (BCWS) A Finished 200 B Finished 200 Finished 400 D Finished 150 E Finished 350 F 10% 100 Cumulative Totals b) Based on the tables, what is your assessment for the progress of the project at the end of periods 1, 2, 3, 4, 5, 6, 7, and 8. 1.5 marks c) Calculate the Schedule Performance Index (SPI), Cost Performance Index (CPT), and Estimate at Completion (EAC) for each report period and fill in the table below. 0.5 marks Indexes Period SPI CPI EAC 2 SPI= EV /PT CPI = EV AC EAC=BAC/CPI 00 d) Using the above data, plot the curves for PV, EV, and AC on a graph. (You can either: (1) manually sketch the graph on a piece of paper, take a photo with your cell phone, and insert the picture in the report or () electronically create the graph using Excel of another software.) 0.5 marks e) Discuss the project prospects based on the graph and based on the calculated values for the performance indices. 0.5 marks

Step by Step Solution

There are 3 Steps involved in it

1 Expert Approved Answer
Step: 1 Unlock blur-text-image
Question Has Been Solved by an Expert!

Get step-by-step solutions from verified subject matter experts

Step: 2 Unlock
Step: 3 Unlock

Students Have Also Explored These Related General Management Questions!