

Question: Please Help. Problem 14-1A Comparative statement data for Farris Company and Ratzlaff Company, two competitors, appear below. All balance sheet data are as of December
 Please Help.
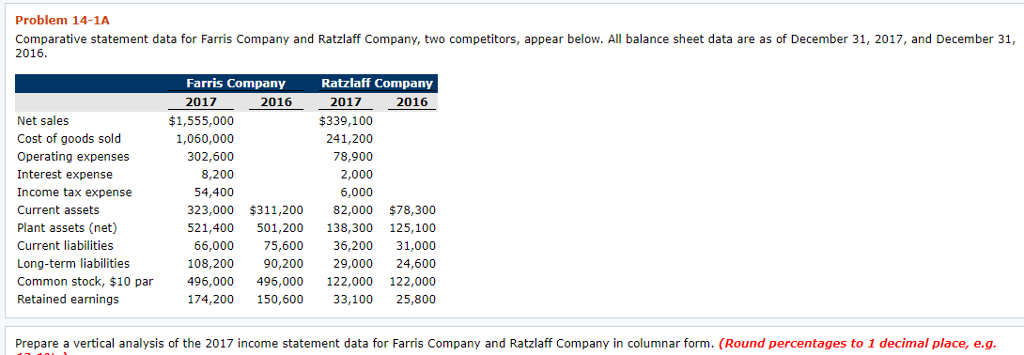
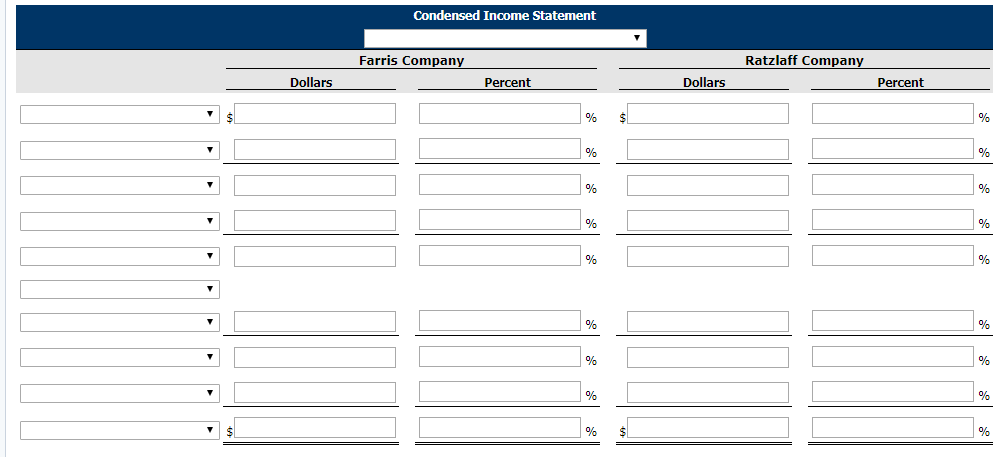
Problem 14-1A Comparative statement data for Farris Company and Ratzlaff Company, two competitors, appear below. All balance sheet data are as of December 31, 2017, and December 31, 2016 Farris Company 2017 Ratzlaff Company 2017 2016 2016 Net sales Cost of goods sold Operating expenses Interest expense Income tax expense Current assets Plant assets (net) Current liabilities Long-term liabilities Common stock, $10 par Retained earnings $1,555,000 1,060,000 $339,100 241,200 78,900 2,000 6,000 302,600 8,200 54,400 323,000 $311,200 82,000 $78,300 521,400 501,200 138,300 125,100 66,000 75,600 36,200 31,000 108,200 90,200 29,000 24,600 122,000 174,200 150,600 33,100 25,800 496,000 496,000 122,000 Prepare a vertical analysis of the 2017 income statement data for Farris Company and Ratzlaff Company in columnar form. (Round percentages to 1 decimal place, e.g
Step by Step Solution
There are 3 Steps involved in it

Get step-by-step solutions from verified subject matter experts