

Question: Problem 2: (10 Points) Comparative financial statement data of Canfield, Inc. follow: CANFIELD, INC Comparative Income Statement Years Ended December 31, 2016 and 2015 2016
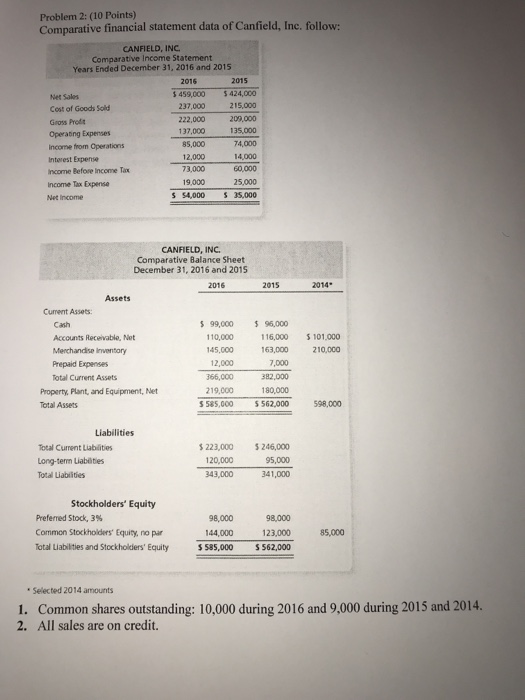
Problem 2: (10 Points) Comparative financial statement data of Canfield, Inc. follow: CANFIELD, INC Comparative Income Statement Years Ended December 31, 2016 and 2015 2016 2015 Net Sales Cost of Goods Sold Gross Prod Operatng Expenses income from Operations Intorest Expense ncome Before Income Tax Income Tax Expense Net Income $459,000 424,00o 237,000215,000 222,000 209,000 135,000 74,000 14,000 60,000 25,000 S 54,000 35,000 137,000 85,000 12,000 73,000 19,000 CANFIELD, INC Comparative Balance Sheet December 31, 2016 and 2015 2016 2015 2014 Assets Cument Assets: Cash Accounts Receivable, Net Merchandise Inventory Prepaid Expenses Total Current Assets 99,000 96,000 0,000 16,000 101,000 45,000 163,000 210,000 12,000 366,000 382,000 19,000 7,000 180,000 Property, Plant, and Equipment, Net Total Assets 585,000 $62,000 98,000 Liabilities 223,000 246,000 120,000 343,000 Total Cument Liabilities 95,000 Long-term Liablities Total Liabiities 341,000 Stockholders' Equity Preferred Stock, 3% Common Stockholders' Equity, no par Total Liabilties and Stockholders' Equity 98,000 98,000 144,000 123,000 85,000 $585,000 562,000 Selected 2014 amounts 1. 2. Common shares outstanding: 10,000 during 2016 and 9,000 during 2015 and 2014. All sales are on credit
Step by Step Solution
There are 3 Steps involved in it

Get step-by-step solutions from verified subject matter experts