

Question: this is one question 100% recenthless 3. Inventory over Cost of goods sold Average inventory Days la inventory Indicates tility of inventory--the amber of times
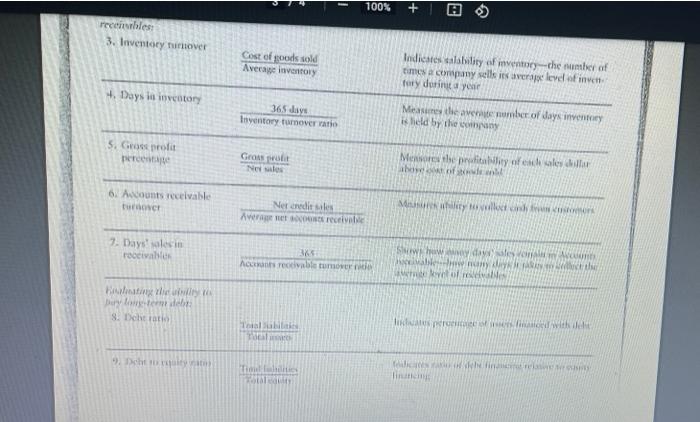
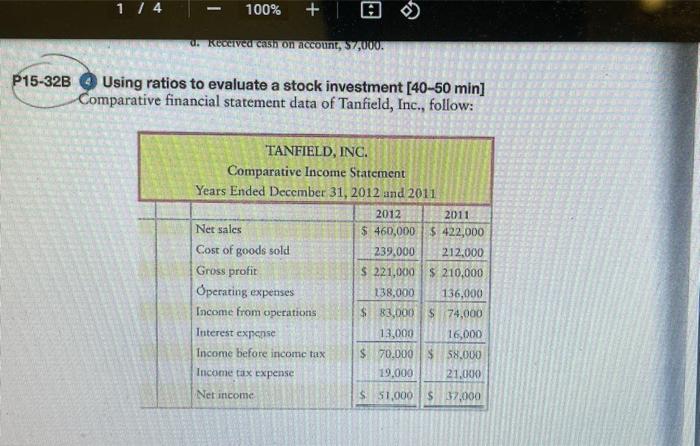
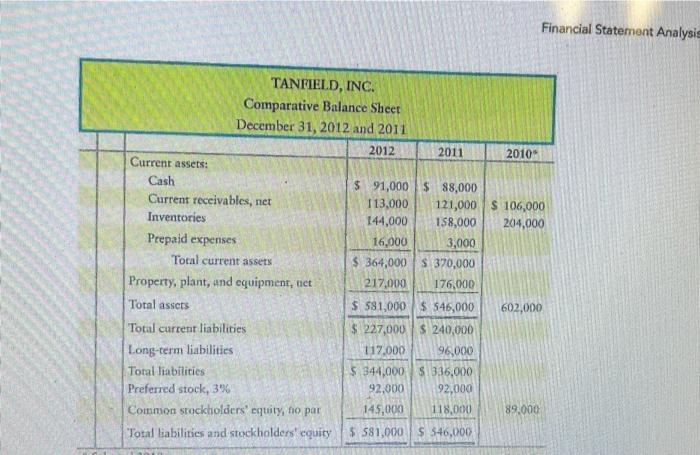
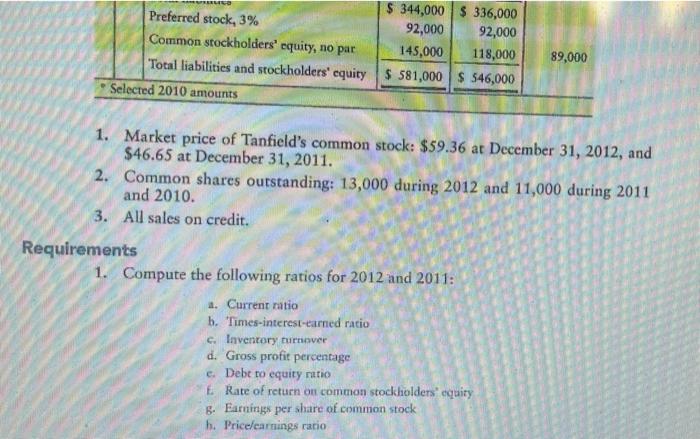
100% recenthless 3. Inventory over Cost of goods sold Average inventory Days la inventory Indicates tility of inventory--the amber of times a company sells its average level of inen tory during your Measures le avember of days in is lield by the 365days Inventory turnover ratio 5. Goprolit perce Growlit Neste Menores the play of elder 6. Acounts receivable tur Neredits A receive Mility with 7. Days'salecin receivables 35 A receivable tumor Show les Hwy whe ol lating the Dery lower 8. Dicha To pred with ch Til tal 1 / 4 100% + u. Keceived cash on account, 57,000. P15-32B Using ratios to evaluate a stock investment [40-50 min) Comparative financial statement data of Tanfield, Inc., follow: TANFIELD, INC. Comparative Income Statement Years Ended December 31, 2012 and 2011 2012 2011 Net sales $ 460,000 1 $ 422,000 Cost of goods sold 239,000 212,000 Gross profit $ 221,000 $ 210,000 Operating expenses 138,000 136,000 Income from operations $ 83,000 $ 74,000 Interest expense 13,000 16,000 Income before income tax $ 70.000 58.000 Income tax expense 19.000 21,000 Net income $ 51,000$ 37,000 Financial Statement Analysis TANFIELD, INC. Comparative Balance Sheet December 31, 2012 and 2011 2012 2011 2010 Current assets: Cash $ 91,000$ 88,000 Current receivables, net 113,000 121,000 $ 106,000 Inventories 144,000 158,000 204,000 Prepaid expenses 16.000 3,000 Tocal current assets $ 364,000$ 370,000 Property, plant, and equipment, tict 217,000 176,000 Total assets $ 581,000 $ 545,000 602,000 Total current liabilities $ 227,000 $ 240,000 Long-term liabilities 117,000 96,000 Total liabilities $ 344,000 $ 336,000 Preferred stock, 396 92,000 92,000 Common stockholders' equity, no par 145,000 118,000 89,000 Total abilities and stockholders' equity $ 581,000 $546,000 $ 344,000$ 336,000 Preferred stock, 3% 92,000 92,000 Common stockholders' equity, no par 145,000 118,000 Total liabilities and stockholders' equity $ 581,000 $546,000 Selected 2010 amounts 89,000 1. Market price of Tanfield's common stock: $59.36 at December 31, 2012, and $46.65 at December 31, 2011. 2. Common shares outstanding: 13,000 during 2012 and 11,000 during 2011 and 2010. 3. All sales on credit. Requirements 1. Compute the following ratios for 2012 and 2011: a. Current ratio b. Times-interest-eared ratio C. Inventory turnover d. Gross profit percentage c. Debt to equity ratio E Rate of return on common stockholders' equiry 5. Earnings per share of common stock h. Price/earnings ratio
Step by Step Solution
There are 3 Steps involved in it

Get step-by-step solutions from verified subject matter experts