

Question: Question #5 (25 points) Comparative financial statement data of Evelin, Inc. follow: Evelin, Inc. Comparative Income Statement Years Ended December 31, 2018 and 2017 2018
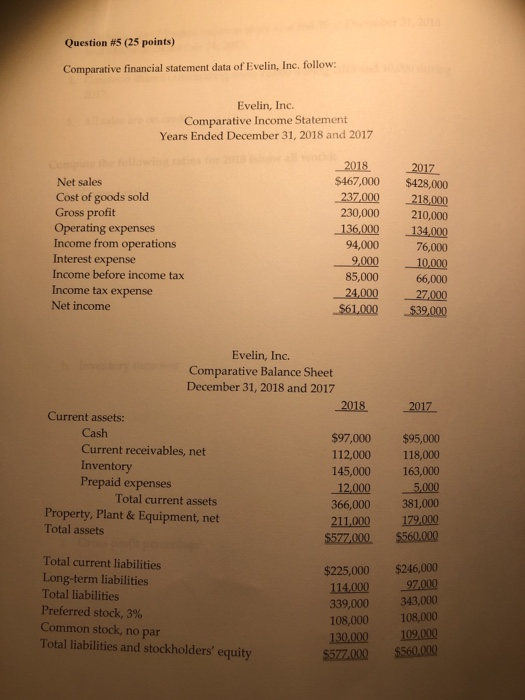
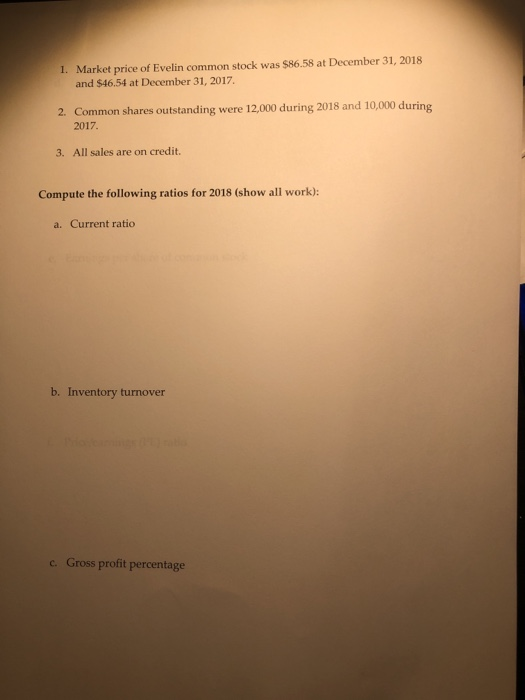
Question #5 (25 points) Comparative financial statement data of Evelin, Inc. follow: Evelin, Inc. Comparative Income Statement Years Ended December 31, 2018 and 2017 2018 2017 Net sales Cost of goods sold Gross proft Operating expenses Income from operations Interest expense Income before income tax Income tax expense Net income $467,000 $428,000 -237,000 8,000 230,000 210,000 136,000 134,000 76,000 94,000 85,000 66,000 -24,000 27,000 $61,000 $39,000 Evelin, Inc. Comparative Balance Sheet December 31, 2018 and 2017 2018 2017 Current assets: Cash Current receivables, net Inventory Prepaid expenses $97,000 $95,000 112,000 118,000 145,000 163,000 12,0005,000 366,000381,000 211,000 179.000 577.000 $560,000 Total current assets Property, Plant & Equipment, net Total assets Total current liabilities Long-term liabilities Total liabilities Preferred stock, 3% Common stock, no par Total liabilities and stockholders' equity $225,000$246,000 114,00097000 339,000 343,000 108,000108,000 130,000109.000 577.000 $560,000 Market price of Evelin common stock was $86.58 at December 31, 2018 and $46.54 at December 31, 20127 1. 2. Common shares outstanding were 12,000 during 2018 and 10,000 during 2017 3. All sales are on credit. Compute the following ratios for 2018 (show all work): a. Current ratio b. Inventory turnover Gross profit percentage d. Debt to equity ratio e. Earnings per share of common stock f. Price/earnings (PE) ratio
Step by Step Solution
There are 3 Steps involved in it

Get step-by-step solutions from verified subject matter experts