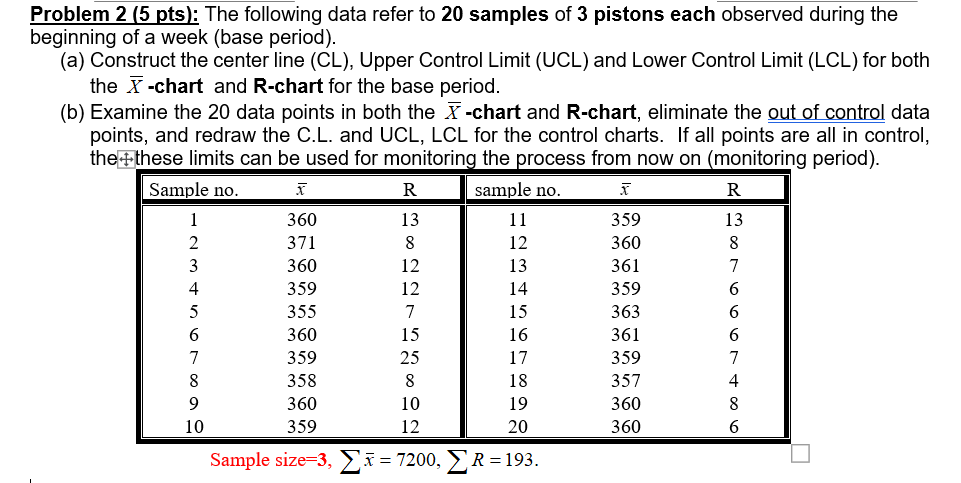
Question: Problem 2 (5 pts): The following data refer to 20 samples of 3 pistons each observed during the beginning of a week (base period). (a)

Problem 2 (5 pts): The following data refer to 20

Problem 2 (5 pts): The following data refer to 20 samples of 3 pistons each observed during the beginning of a week (base period). (a) Construct the center line (CL), Upper Control Limit (UCL) and Lower Control Limit (LCL) for both the X -chart and R-chart for the base period. (b) Examine the 20 data points in both the X -chart and R-chart, eliminate the out of control data points, and redraw the C.L. and UCL, LCL for the control charts. If all points are all in control, the+these limits can be used for monitoring the process from now on (monitoring period). Sample no. R sample no. I R 1 360 13 11 359 13 2 371 8 12 360 8 3 360 12 13 361 7 4 359 12 14 359 6 5 355 7 15 363 6 360 15 16 361 7 359 25 17 359 8 358 18 357 9 360 10 19 360 10 359 12 20 360 Sample size=3, = 7200, R = 193. 6 6 7 4 bot 8 6

Step by Step Solution

There are 3 Steps involved in it

1 Expert Approved Answer
Step: 1 Unlock blur-text-image
Question Has Been Solved by an Expert!

Get step-by-step solutions from verified subject matter experts

Step: 2 Unlock
Step: 3 Unlock

Students Have Also Explored These Related General Management Questions!