

Question: Problem 2: foms ane being coenpletely correctly. The cormpany intends to the the chart to see if inpoovememts in the design of the fotm are
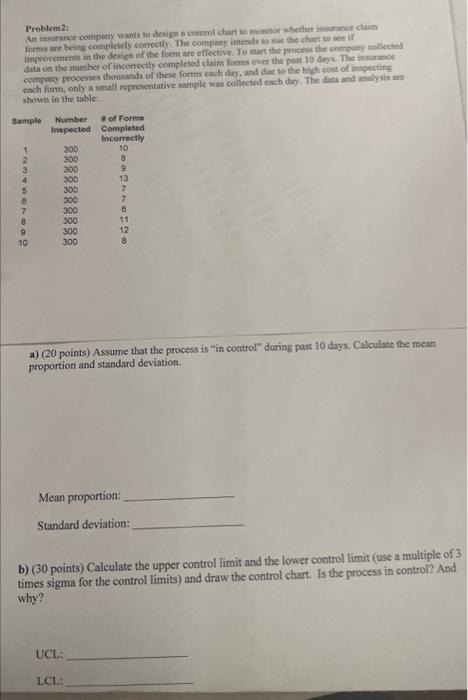
Problem 2: foms ane being coenpletely correctly. The cormpany intends to the the chart to see if inpoovememts in the design of the fotm are cilective. To itart the procest the compang collectiol data un the namber of incorrectly completed claim forms over the past 10 drys. The insurance thown in the table a) (20 points) Assume that the process is "in control" during past 10 days. Calculate the mean proportion and standard deviation. Mean proportion: Standard deviation: b) ( 30 points) Calculate the upper control limit and the lower control limit (use a multiple of 3 times sigma for the control limits) and draw the control chart. Is the process in control? And why? UCL: LCL
Step by Step Solution
There are 3 Steps involved in it

Get step-by-step solutions from verified subject matter experts