

Question: Problem 2. In the previous problem, you and different standard deviations. Some portfolio configurations are better than others, but which one is the one with
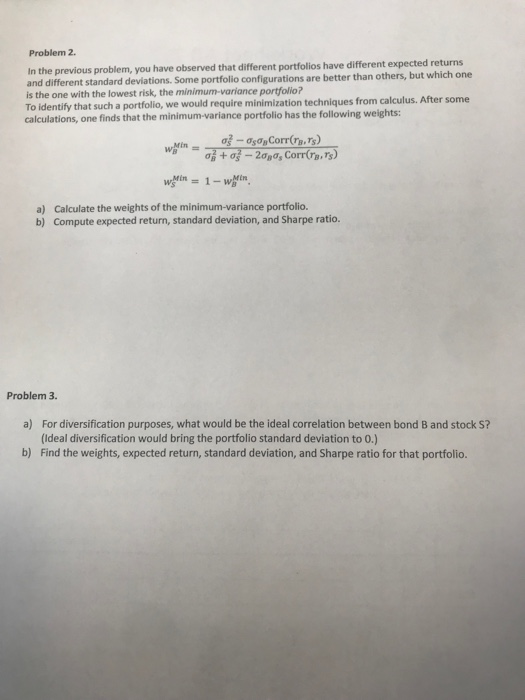
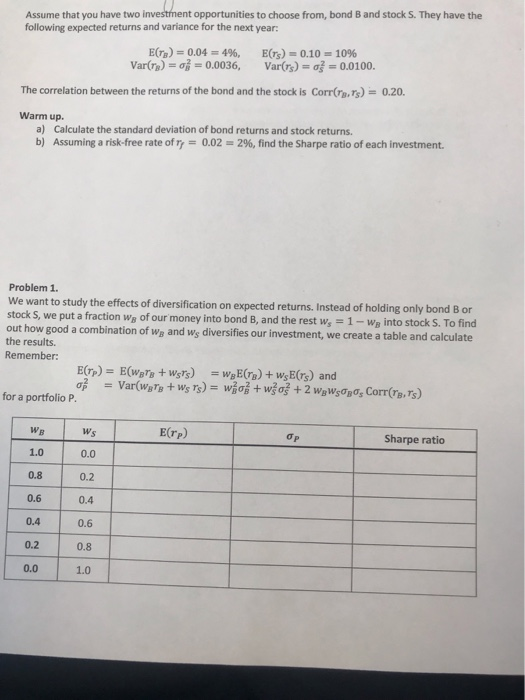

Problem 2. In the previous problem, you and different standard deviations. Some portfolio configurations are better than others, but which one is the one with the lowest risk, the minimum-variance To identify that such a portfolio, we would require minimization techniques from calculus. After some calculations, one finds that the minimum-variance portfolio has the following weights: have observed that different portfolios have different expected returns portfolio? og + -20po, Corr(re.rs) 1n Calculate the weights of the minimum-variance portfolio. a) b) Compute expected return, standard deviation, and Sharpe ratio. Problem 3. For diversification purposes, what would be the ideal correlation between bond B and stock S? (Ideal diversification would bring the portfolio standard deviation to 0.) b) a) Find the weights, expected return, standard deviation, and Sharpe ratio for that portfolio. nt opportunities to choose from, bond B and stock S. They have the Assume that you have two following expected returns and variance for the next year: E(r's). 0.10., 1096 Var()-|-0.0100. E(n)s 0.04-496, Var(a)s,# 0.0036, The correlation between the returns of the bond and the stock is Corrs,rs)-0.20. Warm up Calculate the standard deviation of bond returns and stock returns. a) b) Assuming a risk-free rate of 0.02 2%, find the Sharpe ratio of each investment. Problem 1. We want to study the effects of diversification on expected returns. Instead of holding only bond B or stock S, we put a fraction wg of our money into bond B, and the rest w,1 out how good a combination of Wa and ws diversifies our investment, we create a table and calculate the results. -WB into stock S. To find Remember: for a portfolio P. E(rP) WB Ws Sharpe ratio 1.0 0.0 0.8 0.2 0.6 0.4 0.4 0.6 0.2 0.8 0.0 1.0 nt opportunities to choose from, bond B and stock S. They have the Assume that you have two following expected returns and variance for the next year: E(r's). 0.10., 1096 Var()-|-0.0100. E(n)s 0.04-496, Var(a)s,# 0.0036, The correlation between the returns of the bond and the stock is Corrs,rs)-0.20. Warm up Calculate the standard deviation of bond returns and stock returns. a) b) Assuming a risk-free rate of 0.02 2%, find the Sharpe ratio of each investment. Problem 1. We want to study the effects of diversification on expected returns. Instead of holding only bond B or stock S, we put a fraction wg of our money into bond B, and the rest w,1 out how good a combination of Wa and ws diversifies our investment, we create a table and calculate the results. -WB into stock S. To find Remember: for a portfolio P. E(rP) WB Ws Sharpe ratio 1.0 0.0 0.8 0.2 0.6 0.4 0.4 0.6 0.2 0.8 0.0 1.0 Problem 2. In the previous problem, you and different standard deviations. Some portfolio configurations are better than others, but which one is the one with the lowest risk, the minimum-variance To identify that such a portfolio, we would require minimization techniques from calculus. After some calculations, one finds that the minimum-variance portfolio has the following weights: have observed that different portfolios have different expected returns portfolio? og + -20po, Corr(re.rs) 1n Calculate the weights of the minimum-variance portfolio. a) b) Compute expected return, standard deviation, and Sharpe ratio. Problem 3. For diversification purposes, what would be the ideal correlation between bond B and stock S? (Ideal diversification would bring the portfolio standard deviation to 0.) b) a) Find the weights, expected return, standard deviation, and Sharpe ratio for that portfolio. nt opportunities to choose from, bond B and stock S. They have the Assume that you have two following expected returns and variance for the next year: E(r's). 0.10., 1096 Var()-|-0.0100. E(n)s 0.04-496, Var(a)s,# 0.0036, The correlation between the returns of the bond and the stock is Corrs,rs)-0.20. Warm up Calculate the standard deviation of bond returns and stock returns. a) b) Assuming a risk-free rate of 0.02 2%, find the Sharpe ratio of each investment. Problem 1. We want to study the effects of diversification on expected returns. Instead of holding only bond B or stock S, we put a fraction wg of our money into bond B, and the rest w,1 out how good a combination of Wa and ws diversifies our investment, we create a table and calculate the results. -WB into stock S. To find Remember: for a portfolio P. E(rP) WB Ws Sharpe ratio 1.0 0.0 0.8 0.2 0.6 0.4 0.4 0.6 0.2 0.8 0.0 1.0 nt opportunities to choose from, bond B and stock S. They have the Assume that you have two following expected returns and variance for the next year: E(r's). 0.10., 1096 Var()-|-0.0100. E(n)s 0.04-496, Var(a)s,# 0.0036, The correlation between the returns of the bond and the stock is Corrs,rs)-0.20. Warm up Calculate the standard deviation of bond returns and stock returns. a) b) Assuming a risk-free rate of 0.02 2%, find the Sharpe ratio of each investment. Problem 1. We want to study the effects of diversification on expected returns. Instead of holding only bond B or stock S, we put a fraction wg of our money into bond B, and the rest w,1 out how good a combination of Wa and ws diversifies our investment, we create a table and calculate the results. -WB into stock S. To find Remember: for a portfolio P. E(rP) WB Ws Sharpe ratio 1.0 0.0 0.8 0.2 0.6 0.4 0.4 0.6 0.2 0.8 0.0 1.0
Step by Step Solution
There are 3 Steps involved in it

Get step-by-step solutions from verified subject matter experts