

Question: Problem 2 Intro The following table shows historical beginning-of-year prices for a stock and the sum of dividends paid throughout the year. A B 1
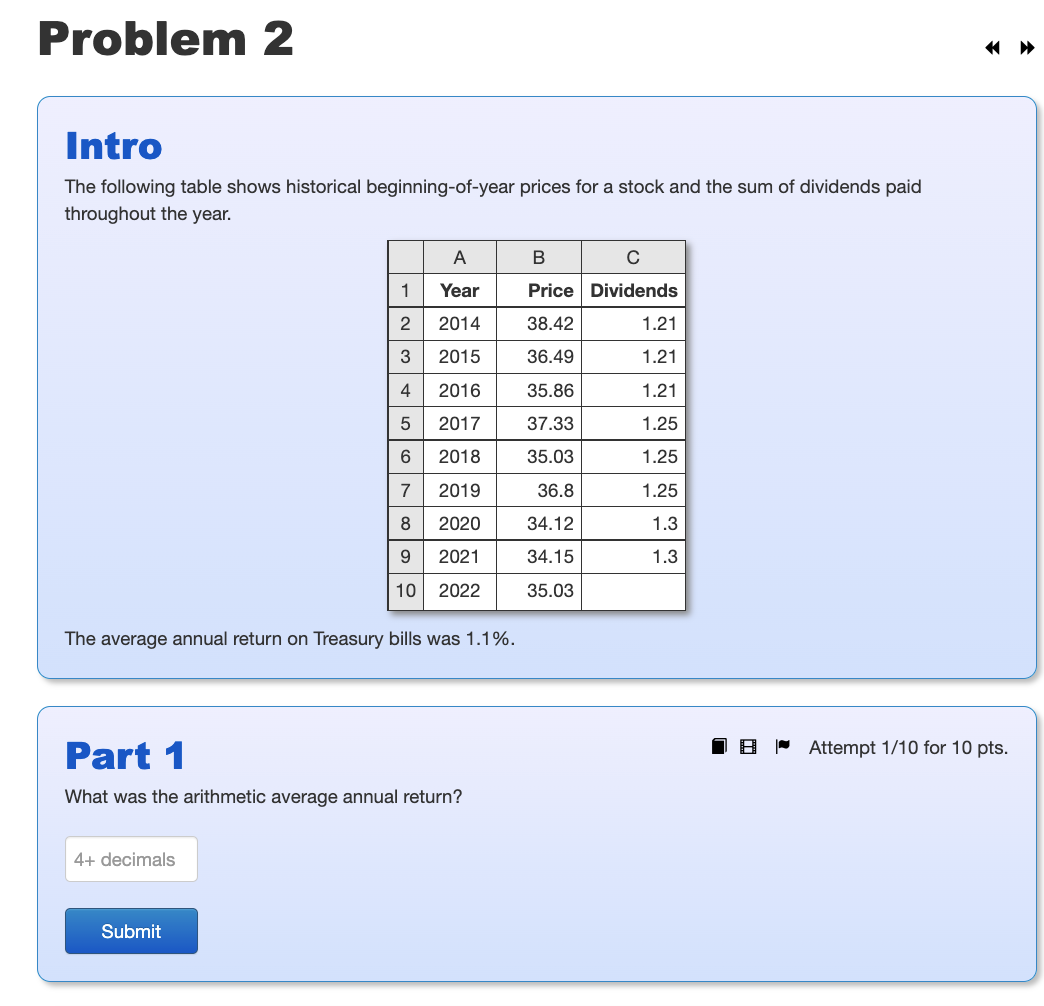
Problem 2 Intro The following table shows historical beginning-of-year prices for a stock and the sum of dividends paid throughout the year. A B 1 Year Price Dividends 2 2014 38.42 1.21 3 2015 36.49 1.21 4 2016 35.86 1.21 5 37.33 1.25 2017 2018 6 35.03 1.25 7 2019 36.8 1.25 8 2020 34.12 1.3 9 2021 34.15 1.3 10 2022 35.03 The average annual return on Treasury bills was 1.1%. IB | Attempt 1/10 for 10 pts. Part 1 What was the arithmetic average annual return? 4+ decimals Submit Part 2 i Attempt 1/10 for 10 pts. What was the standard deviation of returns? 4+ decimals Submit Part 3 Attempt 1/10 for 10 pts. What was the Sharpe ratio of annual returns? 3+ decimals Submit
Step by Step Solution
There are 3 Steps involved in it

Get step-by-step solutions from verified subject matter experts