

Question: Problem #2 Using your work from Problem #1, Calculate the ratios for 2019. Then comment on one ratio from each category that you would investigate
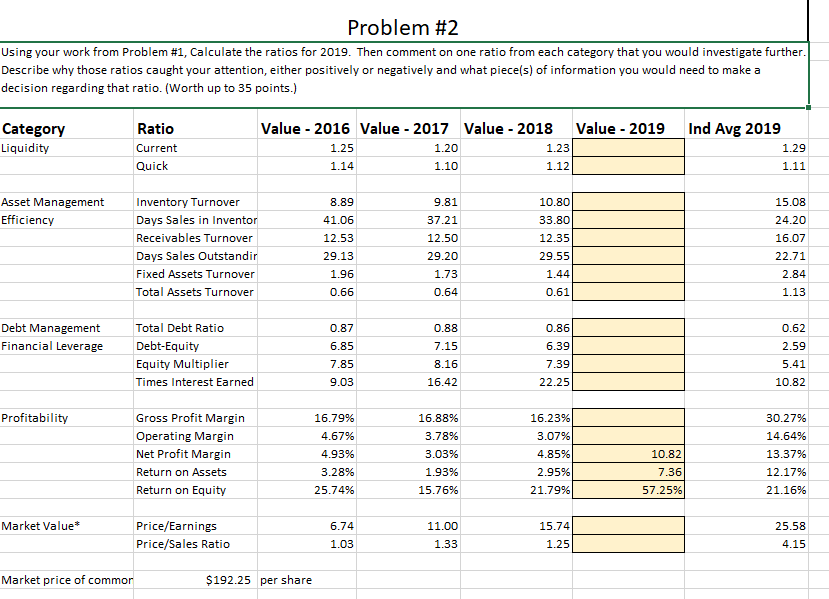
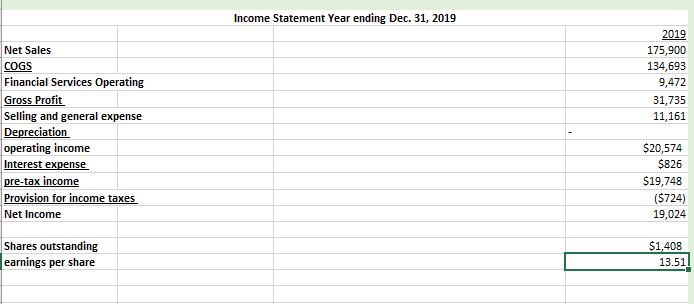
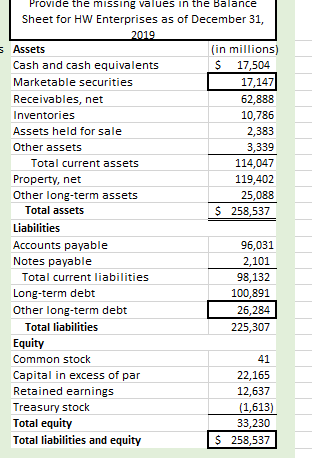
Problem #2 Using your work from Problem #1, Calculate the ratios for 2019. Then comment on one ratio from each category that you would investigate further. Describe why those ratios caught your attention, either positively or negatively and what piece(s) of information you would need to make a decision regarding that ratio. (Worth up to 35 points.) Category Liquidity Ind Avg 2019 Ratio Current Quick Value - 2016 Value - 2017 Value - 2018 Value - 2019 1.25 1.20 1.23 1.14 1.10 1.12 1.29 1.11 10.80 Asset Management Efficiency Inventory Turnover Days Sales in Inventor Receivables Turnover Days Sales Outstandir Fixed Assets Turnover Total Assets Turnover 8.89 41.06 12.53 29.13 15.08 24.20 16.07 9.81 37.21 12.50 29.20 1.73 0.64 33.80 12.35 29.55 1.44 1.96 22.71 2.84 1.13 0.66 0.61 0.62 Debt Management Financial Leverage Total Debt Ratio Debt-Equity Equity Multiplier Times Interest Earned 0.87 6.85 7.85 9.03 0.88 7.15 8.16 16.42 0.86 6.39 7.39 22.25 2.59 5.41 10.82 Profitability Gross Profit Margin Operating Margin Net Profit Margin Return on Assets Return on Equity 16.79% 4.67% 4.93% 16.88% 3.78% 3.03% 1.93% 15.76% 16.23% 3.07% 4.85% 2.95% 21.79% 30.27% 14.64% 13.37% 12.17% 21.16% 10.82 7.36 57.25% 3.28% 25.74% Market Value* 25.58 Price/Earnings Price/Sales Ratio 6.74 1.03 11.00 1.33 15.74 1.25 4.15 Market price of commor $192.25 per share Income Statement Year ending Dec. 31, 2019 2019 175,900 134,693 9,472 31,735 11,161 Net Sales COGS Financial Services Operating Gross Profit Selling and general expense Depreciation operating income Interest expense pre-tax income Provision for income taxes Net Income $20,574 $826 $19,748 ($724) 19,024 Shares outstanding earnings per share $1,408 13.51 Provide the missing values in the Balance Sheet for HW Enterprises as of December 31, 2019 5 Assets (in millions) Cash and cash equivalents $ 17,504 Marketable securities 17,147 Receivables, net 62,888 Inventories 10,786 Assets held for sale 2,383 Other assets 3,339 Total current assets 114,047 Property, net 119,402 Other long-term assets 25,088 Total assets $ 258,537 Liabilities Accounts payable 96,031 Notes payable 2,101 Total current liabilities 98,132 Long-term debt 100,891 Other long-term debt 26,284 Total liabilities 225,307 Equity Common stock 41 Capital in excess of par 22,165 Retained earnings 12,637 Treasury stock (1,613) Total equity 33,230 Total liabilities and equity $ 258,537
Step by Step Solution
There are 3 Steps involved in it

Get step-by-step solutions from verified subject matter experts