

Question: Problem 2.:On the next page, you will find a series of g versus x2 plots for a binary mixture of components 1 and 2 showing
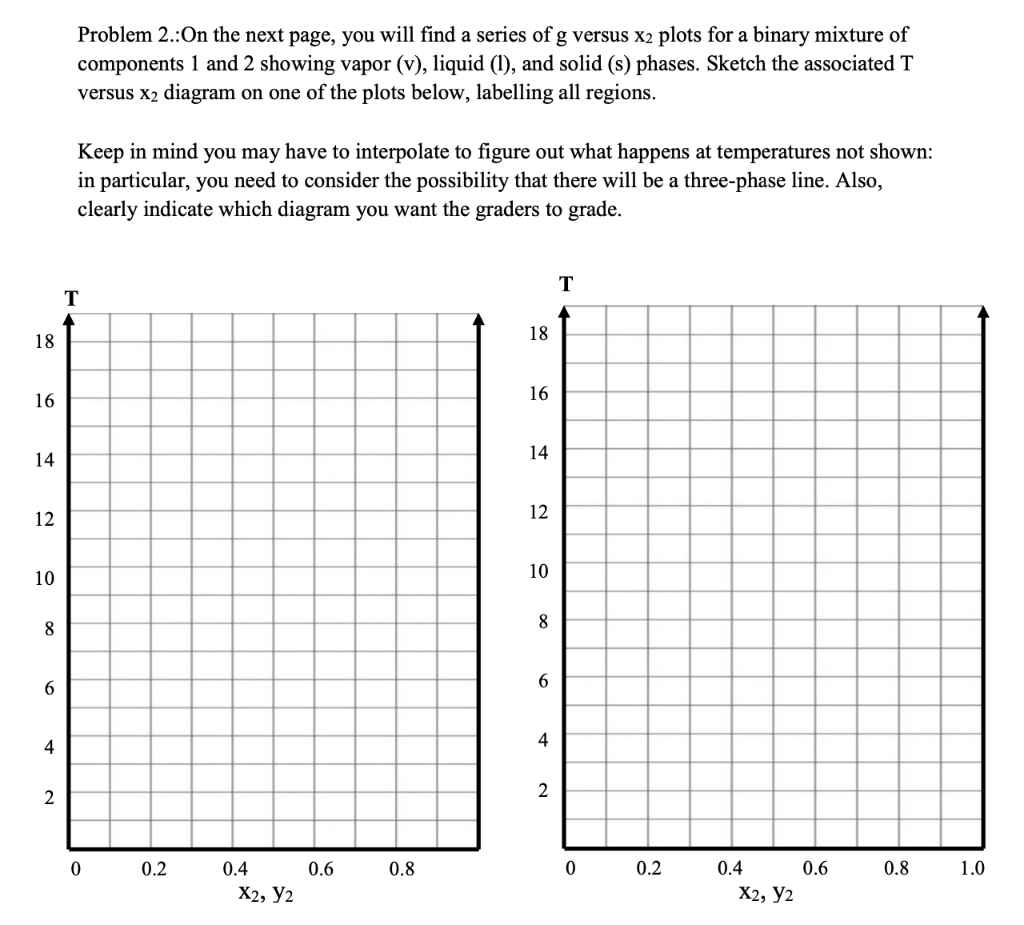
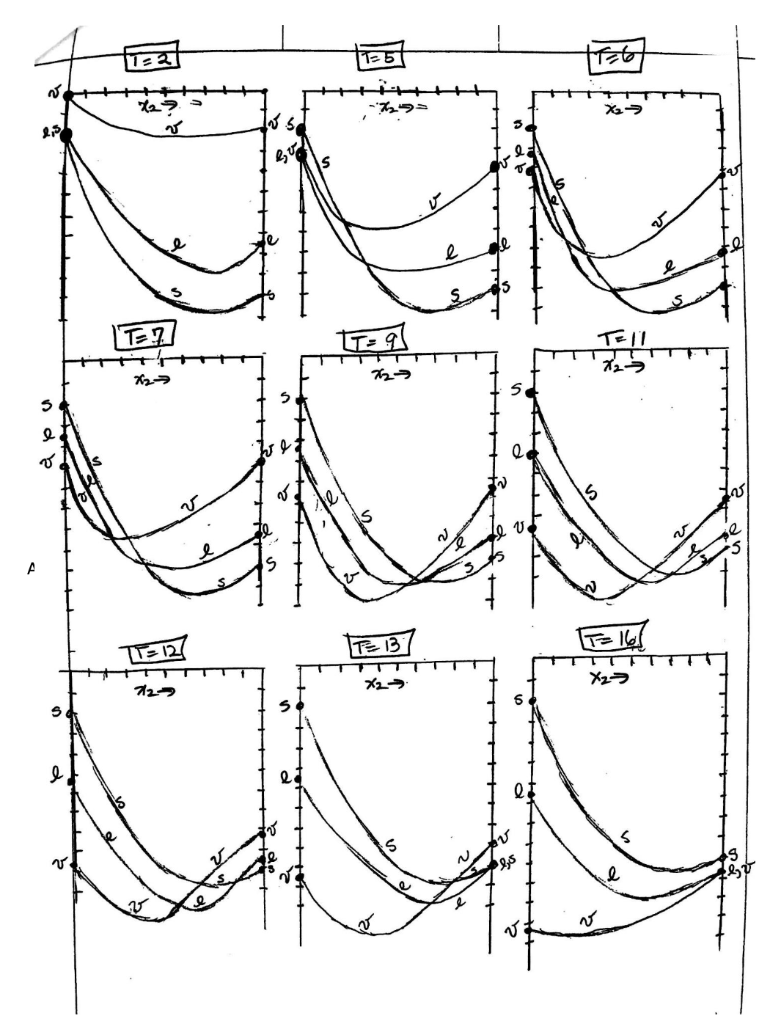
Problem 2.:On the next page, you will find a series of g versus x2 plots for a binary mixture of components 1 and 2 showing vapor (v), liquid (1), and solid (s) phases. Sketch the associated T versus x2 diagram on one of the plots below, labelling all regions. Keep in mind you may have to interpolate to figure out what happens at temperatures not shown: in particular, you need to consider the possibility that there will be a three-phase line. Also, clearly indicate which diagram you want the graders to grade
Step by Step Solution
There are 3 Steps involved in it
1 Expert Approved Answer
Step: 1 Unlock

Question Has Been Solved by an Expert!
Get step-by-step solutions from verified subject matter experts
Step: 2 Unlock
Step: 3 Unlock