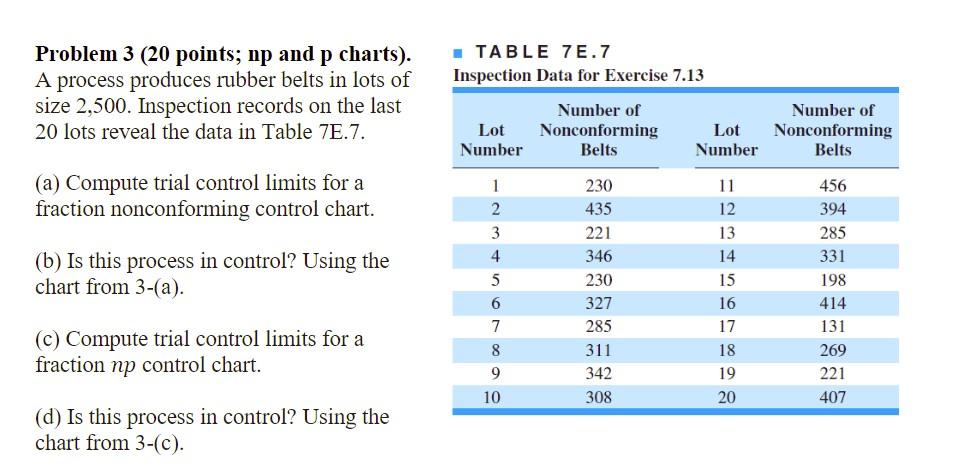
Question: Problem 3 (20 points; np and p charts). TABLE 7 E.7 A process produces rubber belts in lots of Inspection Data for Exercise 7.13 size

Problem 3 (20 points; np and p charts). "TABLE 7

Problem 3 (20 points; np and p charts). "TABLE 7 E.7 A process produces rubber belts in lots of Inspection Data for Exercise 7.13 size 2,500 . Inspection records on the last 20 lots reveal the data in Table 7E.7. (a) Compute trial control limits for a fraction nonconforming control chart. (b) Is this process in control? Using the chart from 3-(a). (c) Compute trial control limits for a fraction np control chart. (d) Is this process in control? Using the chart from 3-(c)

Step by Step Solution

There are 3 Steps involved in it

1 Expert Approved Answer
Step: 1 Unlock blur-text-image
Question Has Been Solved by an Expert!

Get step-by-step solutions from verified subject matter experts

Step: 2 Unlock
Step: 3 Unlock

Students Have Also Explored These Related General Management Questions!