

Question: Problem 3 : The following bar chart shows the activities required to complete a project in six months. After two months on the job (
Problem :
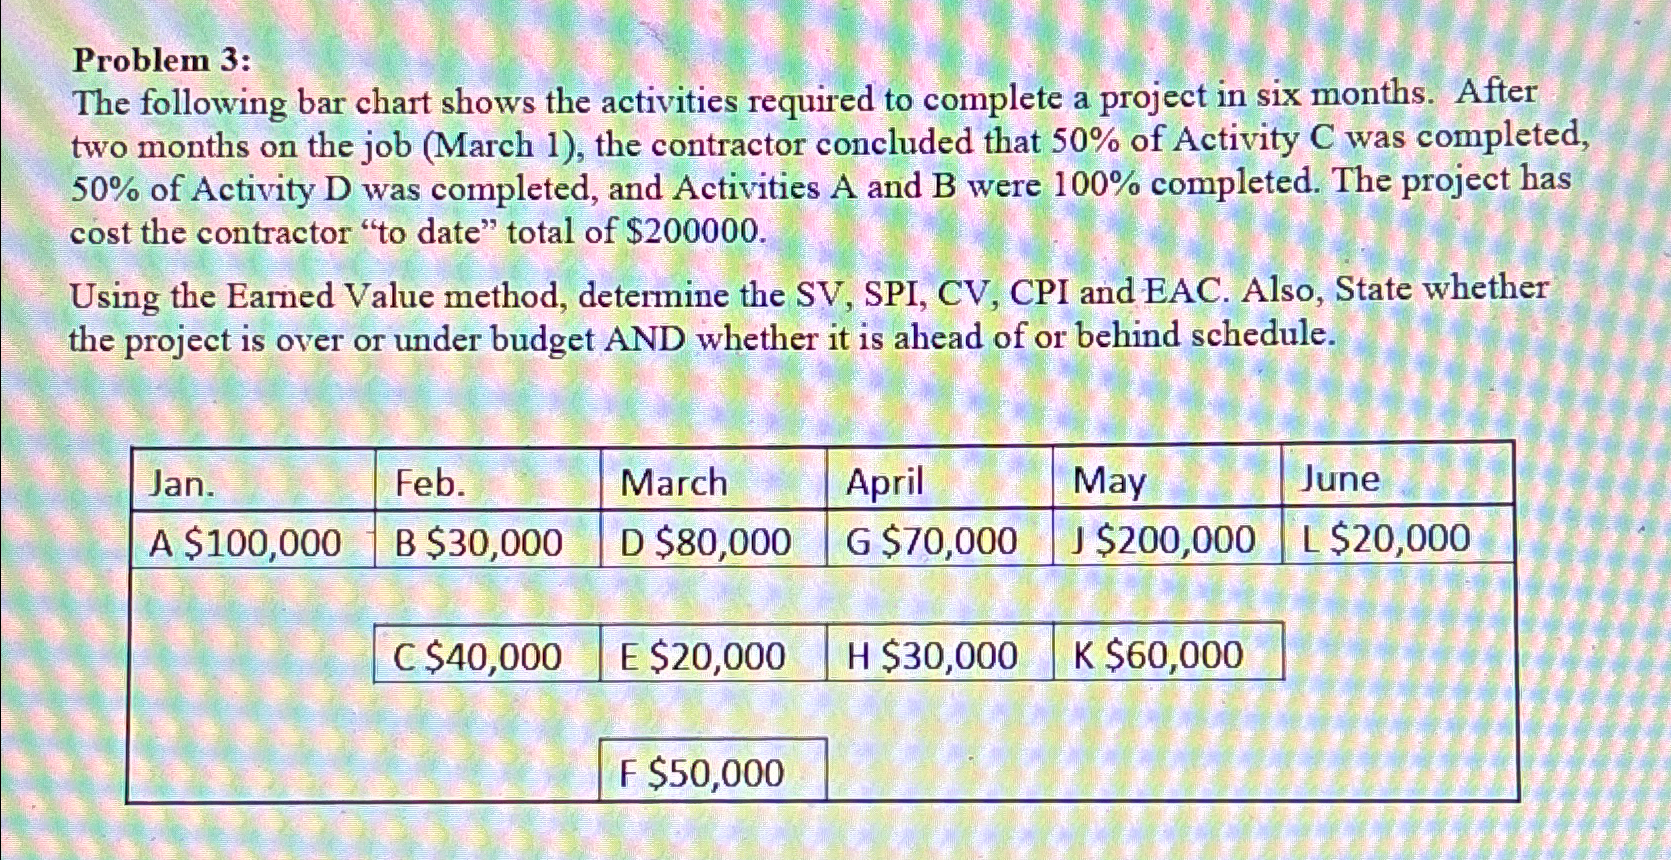
The following bar chart shows the activities required to complete a project in six months. After two months on the job March the contractor concluded that of Activity was completed, of Activity D was completed, and Activities A and B were completed. The project has cost the contractor to date" total of $
Using the Earned Value method, determine the SV SPI, CV CPI and EAC. Also, State whether the project is over or under budget AND whether it is ahead of or behind schedule.
tableJanFeb.,March,April,May,JuneA $B $D $G $J $L $
Step by Step Solution
There are 3 Steps involved in it
1 Expert Approved Answer
Step: 1 Unlock

Question Has Been Solved by an Expert!
Get step-by-step solutions from verified subject matter experts
Step: 2 Unlock
Step: 3 Unlock