

Question: Problem 3 Use ggplot to create the data visualization below. Please use alpha = 0 . 2 5 and color = ' # 0 0
Problem
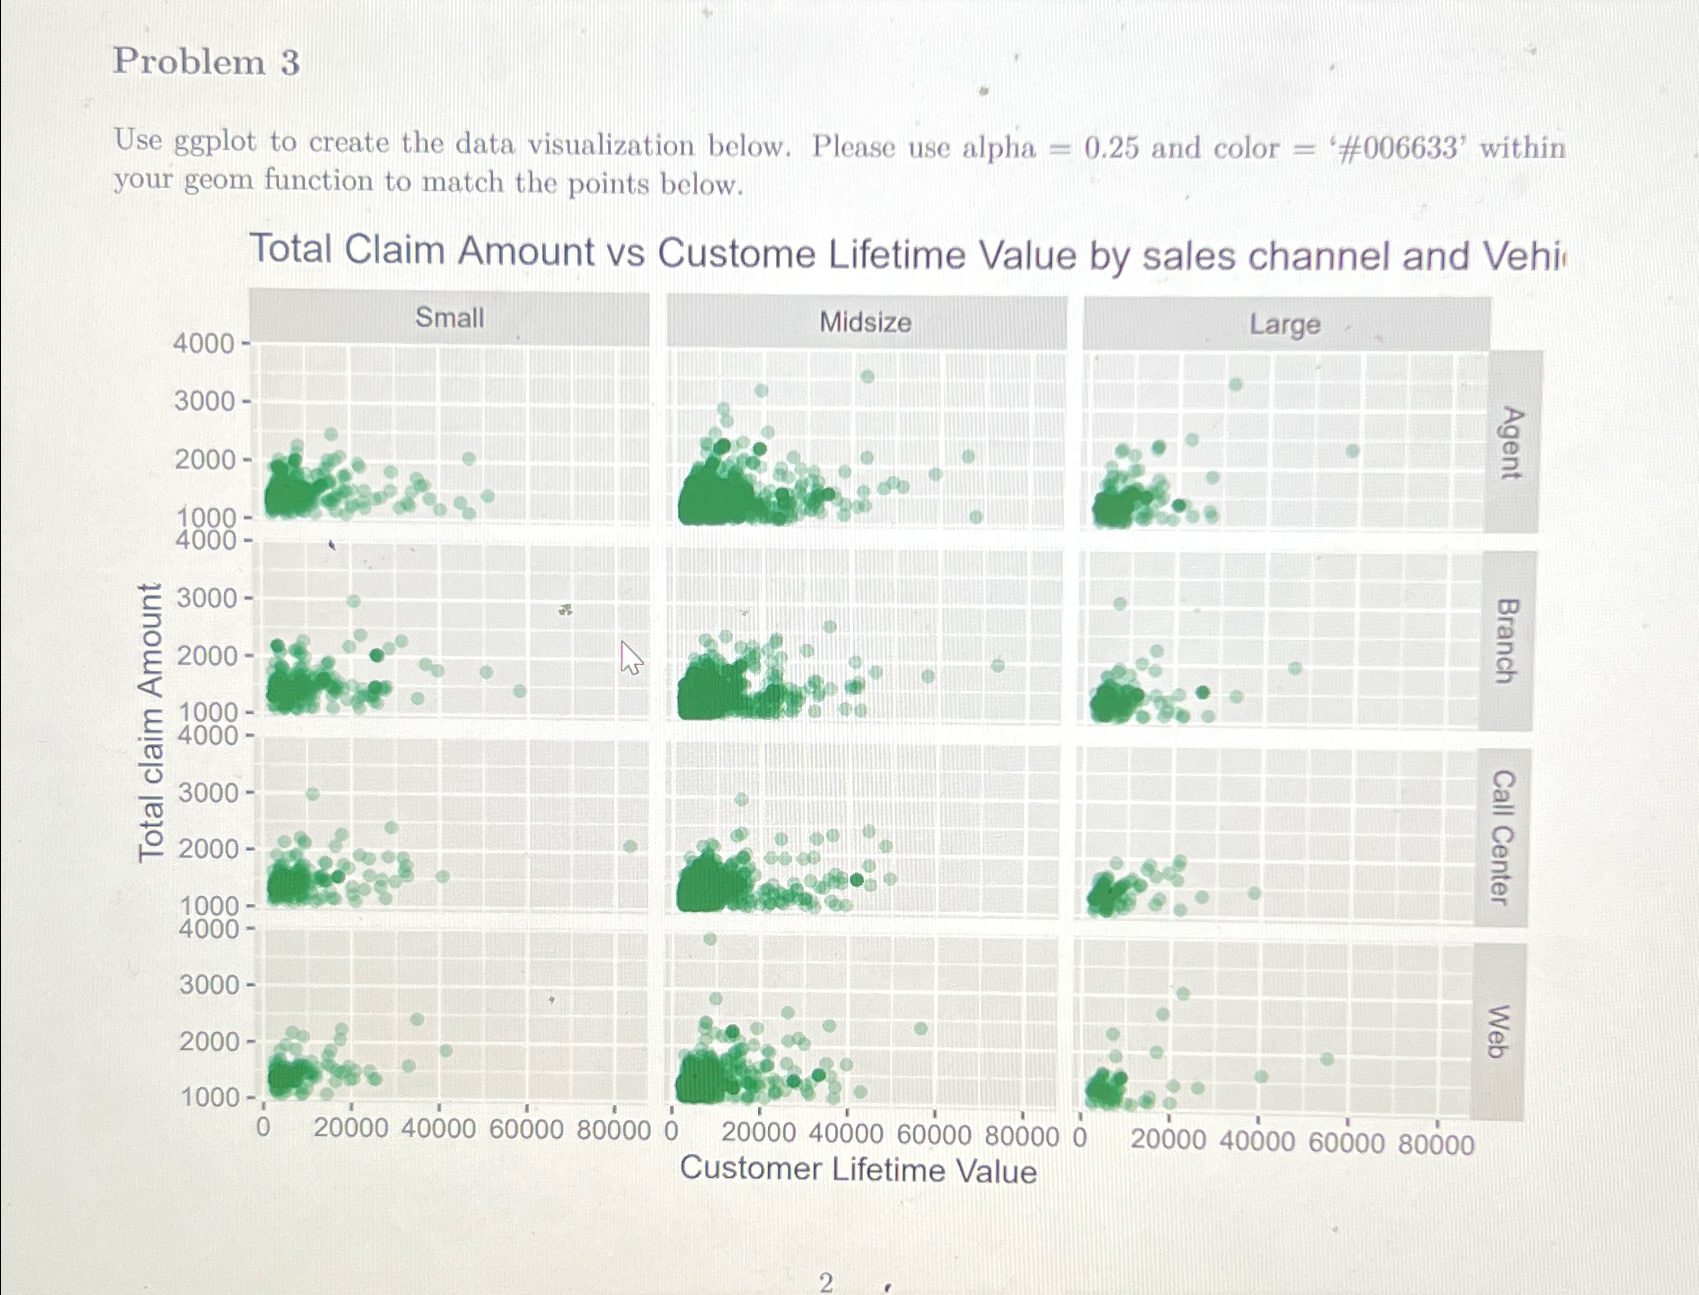
Use ggplot to create the data visualization below. Please use alpha and color # within your geom function to match the points below.
Total Claim Amount vs Custome Lifetime Value by sales channel and Vehi
Step by Step Solution
There are 3 Steps involved in it
1 Expert Approved Answer
Step: 1 Unlock

Question Has Been Solved by an Expert!
Get step-by-step solutions from verified subject matter experts
Step: 2 Unlock
Step: 3 Unlock