

Question: Problem 3 Use ggplot to create the data visualization below. Please use color = '#006633' within your geom function to match the points below.
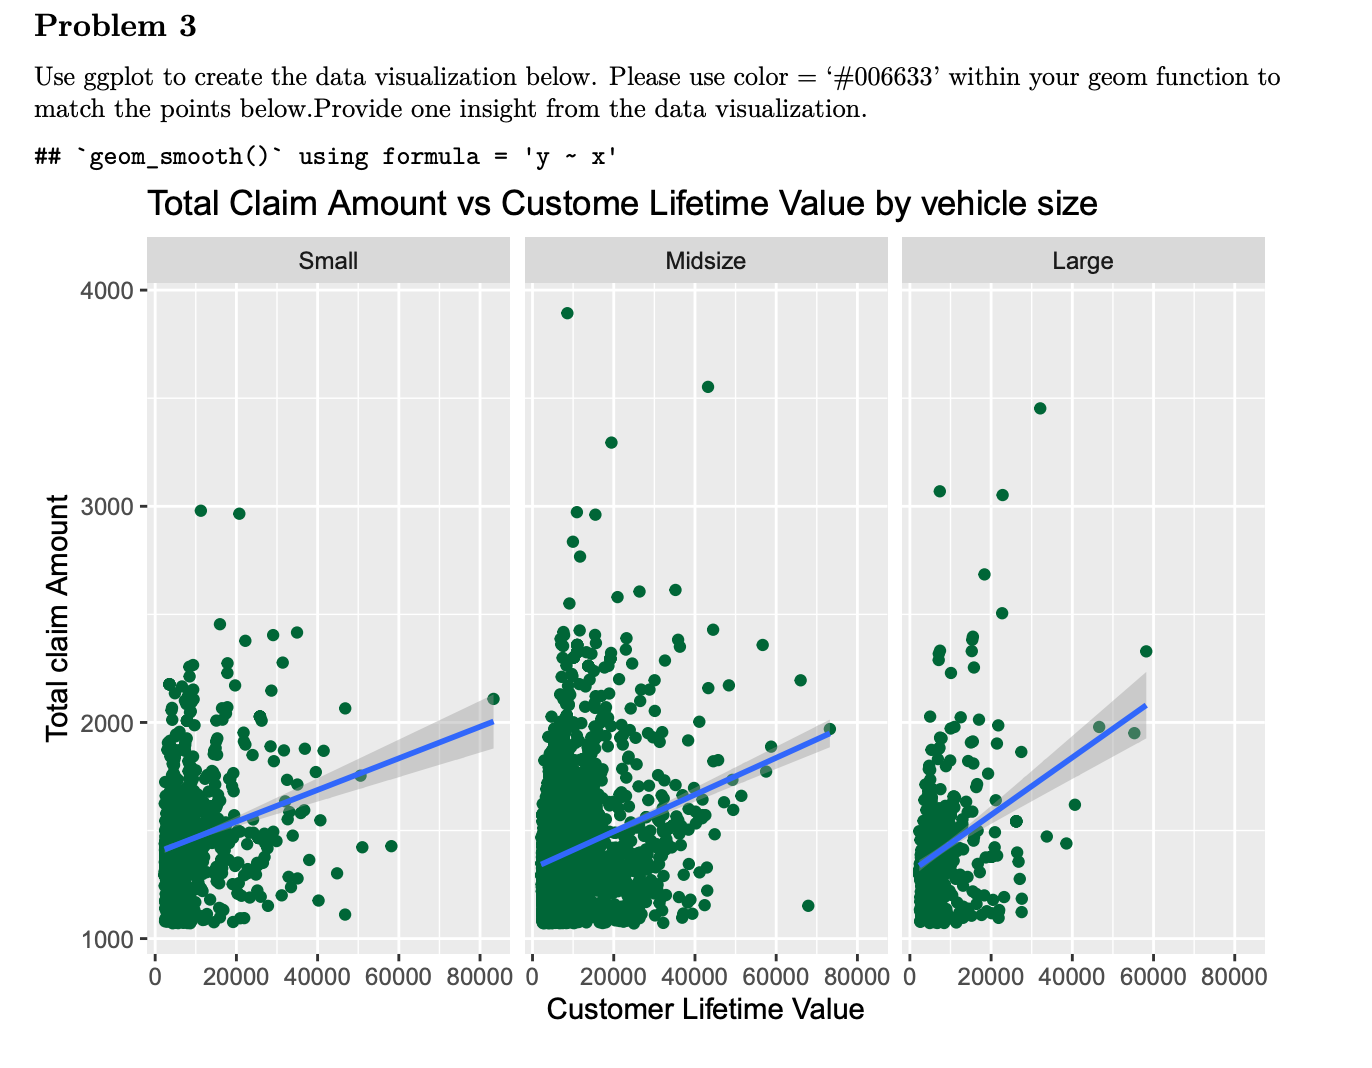
Problem 3 Use ggplot to create the data visualization below. Please use color = '#006633' within your geom function to match the points below. Provide one insight from the data visualization. ## "geom_smooth()` using formula = Total claim Amount N 'y ~ x' Total Claim Amount vs Custome Lifetime Value by vehicle size Midsize Large 4000- 3000 - 2000 - 1000- 0 Small 20000 40000 60000 80000 0 20000 40000 60000 80000 0 20000 40000 60000 80000 Customer Lifetime Value
Step by Step Solution
There are 3 Steps involved in it
The image you provided appears to be a screenshot of an output from a data visualization task typically generated using the ggplot2 package in the R p... View full answer

Get step-by-step solutions from verified subject matter experts