

Question: Problem 3-26 The following data were collected during a study of consumer buying patterns: Observation 1 2 3 4 5 6 7 12 21 44
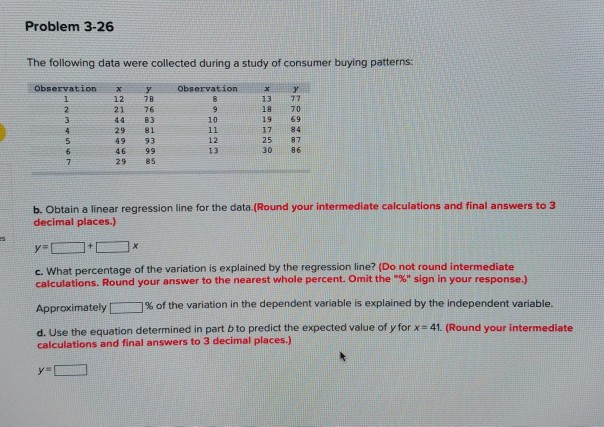
Problem 3-26 The following data were collected during a study of consumer buying patterns: Observation 1 2 3 4 5 6 7 12 21 44 29 49 y 78 76 83 81 93 99 85 Observation 8 9 10 11 12 13 x 13 18 19 17 25 30 Y 77 70 69 84 87 86 29 b. Obtain a linear regression line for the data.(Round your intermediate calculations and final answers to 3 decimal places.) X c. What percentage of the variation is explained by the regression line? (Do not round intermediate calculations. Round your answer to the nearest whole percent. Omit the "%" sign in your response.) Approximately % of the variation in the dependent variable is explained by the independent variable. d. Use the equation determined in part b to predict the expected value of y for x = 41. (Round your intermediate calculations and final answers to 3 decimal places.) y
Step by Step Solution
There are 3 Steps involved in it
1 Expert Approved Answer
Step: 1 Unlock

Question Has Been Solved by an Expert!
Get step-by-step solutions from verified subject matter experts
Step: 2 Unlock
Step: 3 Unlock