

Question: Problem 4. (30 points, 6 points each question) Shares A and B have the following historical returns as given in the table below. You invest
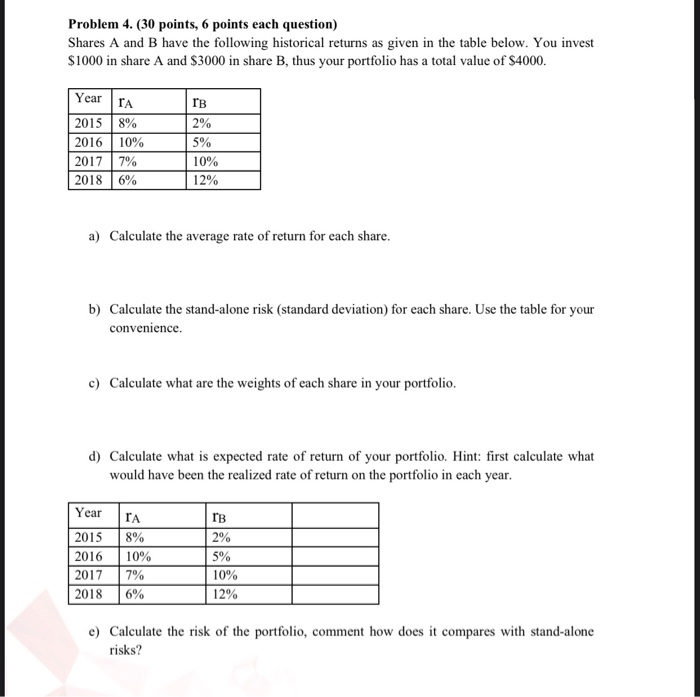
Problem 4. (30 points, 6 points each question) Shares A and B have the following historical returns as given in the table below. You invest $1000 in share A and $3000 in share B, thus your portfolio has a total value of $4000. rB Year ra 2015 8% 2016 10% 2017 7% 2018 6% 2% 5% 10% 12% a) Calculate the average rate of return for each share. b) Calculate the stand-alone risk (standard deviation) for each share. Use the table for your convenience. c) Calculate what are the weights of each share in your portfolio. d) Calculate what is expected rate of return of your portfolio. Hint: first calculate what would have been the realized rate of return on the portfolio in each year. IB 2% Year 2015 2016 2017 2018 ra 8% 10% 7% 6% 5% 10% 12% e) Calculate the risk of the portfolio, comment how does it compares with stand-alone risks
Step by Step Solution
There are 3 Steps involved in it

Get step-by-step solutions from verified subject matter experts