

Question: Problem 4. Monte Carlo simulation and plotting We studied in class Monte Carlo simulation for approximating . Namely, we studied a function which given ,
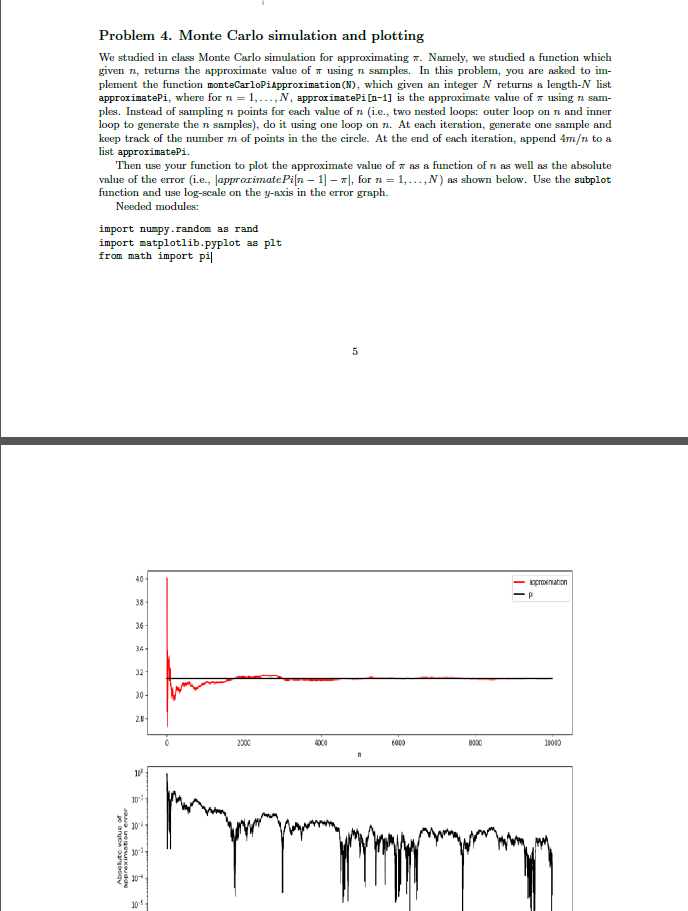
Problem 4. Monte Carlo simulation and plotting We studied in class Monte Carlo simulation for approximating . Namely, we studied a function which given , returns the approximate value of using n samples. In this problem, you are asked to im- plement the function montecarloPiApproximation (N), which given an integer N returns a length-N list approximatei, where for n = 1,..., N, approximatePi [n-1] is the approximate value of using n sam- ples. Instead of sampling n points for each value of n (i.e., two nested loops: outer loop on n and inner loop to generate the n samples), do it using one loop on . At each iteration, generate one sample and keep track of the number m of points in the the circle. At the end of each iteration, append 4m to a list approximatePi. Then use your function to plot the approximate value of as a function of n as well as the absolute value of the error (i.e., (approximate Pin - 1] - |, for n = 1,...,N) as shown below. Use the subplot function and use log-scale on the y-axis in the error graph. Needed modules: import numpy.random as rand import matplotlib.pyplot as plt from math import pil 5 40 cronation 38 36 34 32 20 28 2300 8020 11010 11 30 errer Abouto wole of Approximatione 20- 204 Problem 4. Monte Carlo simulation and plotting We studied in class Monte Carlo simulation for approximating . Namely, we studied a function which given , returns the approximate value of using n samples. In this problem, you are asked to im- plement the function montecarloPiApproximation (N), which given an integer N returns a length-N list approximatei, where for n = 1,..., N, approximatePi [n-1] is the approximate value of using n sam- ples. Instead of sampling n points for each value of n (i.e., two nested loops: outer loop on n and inner loop to generate the n samples), do it using one loop on . At each iteration, generate one sample and keep track of the number m of points in the the circle. At the end of each iteration, append 4m to a list approximatePi. Then use your function to plot the approximate value of as a function of n as well as the absolute value of the error (i.e., (approximate Pin - 1] - |, for n = 1,...,N) as shown below. Use the subplot function and use log-scale on the y-axis in the error graph. Needed modules: import numpy.random as rand import matplotlib.pyplot as plt from math import pil 5 40 cronation 38 36 34 32 20 28 2300 8020 11010 11 30 errer Abouto wole of Approximatione 20- 204
Step by Step Solution
There are 3 Steps involved in it

Get step-by-step solutions from verified subject matter experts