

Question: Problem 4.5. Plot the analyses from Shasta volcano (below) on Fe-index, MALI, and ASI diagrams. Describe these andesites and dacites based on where they plot
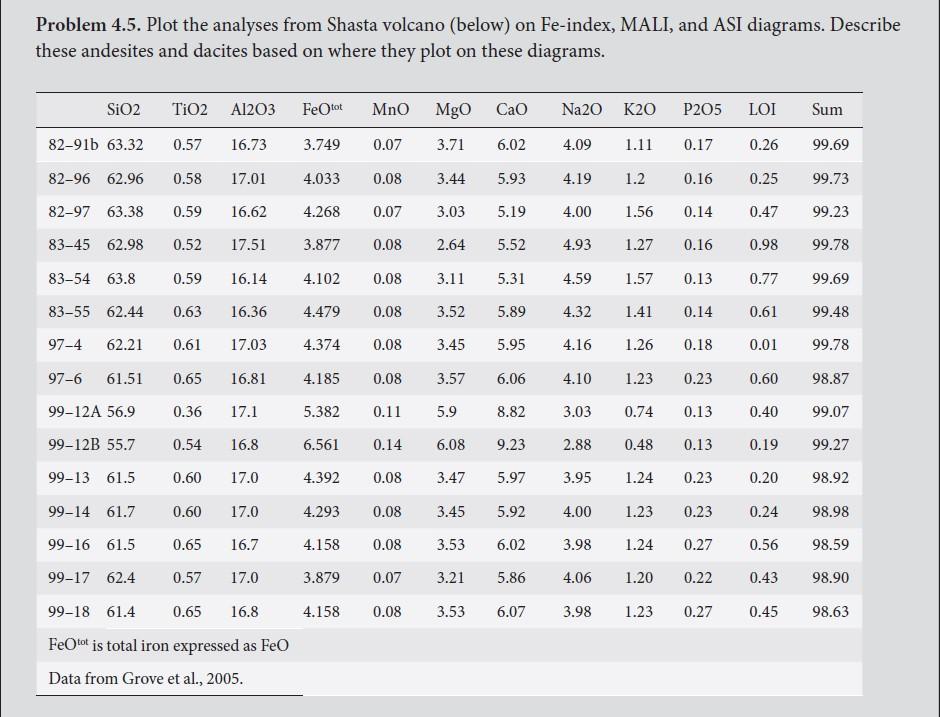
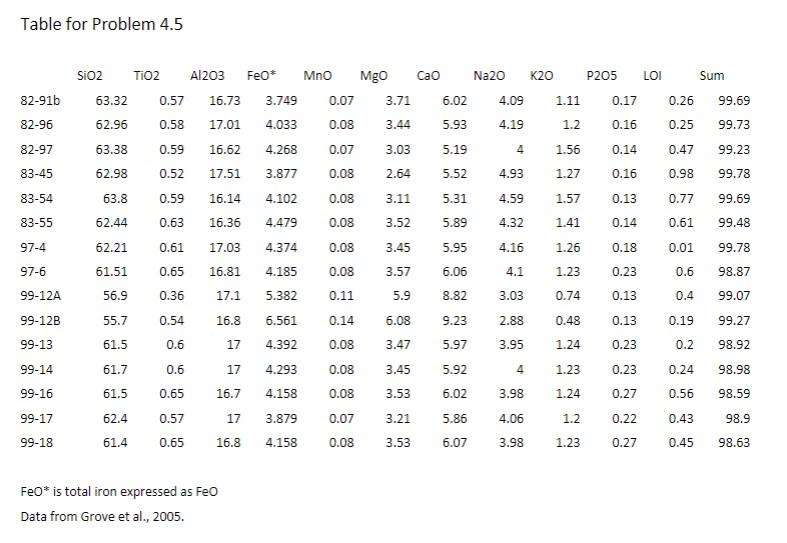
Problem 4.5. Plot the analyses from Shasta volcano (below) on Fe-index, MALI, and ASI diagrams. Describe these andesites and dacites based on where they plot on these diagrams. SiO2 TiO2 A1203 Fetot MnO MgO CaO Na20 K20 P205 LOI Sum 82-916 63.32 0.57 16.73 3.749 0.07 3.71 6.02 4.09 1.11 0.17 0.26 99.69 82-96 62.96 0.58 17.01 4.033 0.08 3.44 5.93 4.19 1.2 0.16 0.25 99.73 82-97 63.38 0.59 16.62 4.268 0.07 3.03 5.19 4.00 1.56 0.14 0.47 99.23 83-45 62.98 0.52 17.51 3.877 0.08 2.64 5.52 4.93 1.27 0.16 0.98 99.78 83-54 63.8 0.59 16.14 4.102 0.08 3.11 5.31 4.59 1.57 0.13 0.77 99.69 83-55 62.44 0.63 16.36 4.479 0.08 3.52 5.89 4.32 1.41 0.14 0.61 99.48 97-4 62.21 0.61 17.03 4.374 0.08 3.45 5.95 4.16 1.26 0.18 0.01 99.78 97-6 61.51 0.65 16.81 4.185 0.08 3.57 6.06 4.10 1.23 0.23 0.60 98.87 99-12A 56.9 0.36 17.1 5.382 0.11 5.9 8.82 3.03 0.74 0.13 0.40 99.07 99-12B 55.7 0.54 16.8 6.561 0.14 6.08 9.23 2.88 0.48 0.13 0.19 99.27 99-13 61.5 0.60 17.0 4.392 0.08 3.47 5.97 3.95 1.24 0.23 0.20 98.92 99-14 61.7 0.60 17.0 4.293 0.08 3.45 5.92 4.00 1.23 0.23 0.24 98.98 99-16 61.5 0.65 16.7 4.158 0.08 3.53 6.02 3.98 1.24 0.27 0.56 98.59 99-17 62.4 0.57 17.0 3.879 0.07 3.21 5.86 4.06 1.20 0.22 0.43 98.90 4.158 0.08 3.53 6.07 3.98 1.23 0.27 0.45 98.63 99-18 61.4 0.65 16.8 FeOtot is total iron expressed as Feo Data from Grove et al., 2005. Table for Problem 4.5 T102 Sum 82-916 0.26 99.69 SiO2 63.32 62.96 63.38 82-96 0.25 99.73 82-97 0.47 99.23 83-45 62.98 0.98 99.78 83-54 63.8 0.77 99.69 83-55 62.44 0.61 99.48 A1203 Feo* Mno Mgo Cao Na20 K20 P205 LOI 0.57 16.73 3.749 0.07 3.71 6.02 4.09 1.11 0.17 0.58 17.01 4.033 0.08 3.44 5.93 4.19 1.2 0.16 0.59 16.62 4.268 0.07 3.03 5.19 4 1.56 0.14 0.52 17.51 3.877 0.08 2.64 5.52 4.93 1.27 0.16 0.59 16.14 4.102 0.08 3.11 5.31 4.59 1.57 0.13 0.63 16.36 4.479 0.08 3.52 5.89 4.32 1.41 0.14 0.61 17.03 4.374 0.08 3.45 5.95 4.16 1.26 0.18 0.65 16.81 4.185 0.08 3.57 6.06 4.1 1.23 0.23 0.36 17.1 5.382 0.11 5.9 8.82 3.03 0.74 0.13 0.54 16.8 6.561 0.14 6.08 9.23 2.88 0.48 0.13 0.6 17 4.392 0.08 3.47 5.97 3.95 1.24 0.23 0.6 17 4.293 0.08 3.45 5.92 4 1.23 0.23 0.65 16.7 4.158 0.08 3.53 6.02 1.24 0.27 97-4 62.21 0.01 99.78 97-6 61.51 0.6 98.87 99-12A 56.9 0.4 99.07 99-12B 55.7 0.19 99.27 99-13 61.5 0.2 98.92 99-14 61.7 0.24 98.98 99-16 61.5 3.98 0.56 98.59 99-17 62.4 0.57 17 3.879 0.07 3.21 5.86 4.06 1.2 0.22 0.43 98.9 99-18 61.4 0.65 16.8 4.158 0.08 3.53 6.07 3.98 1.23 0.27 0.45 98.63 FeO* is total iron expressed as Feo Data from Grove et al., 2005. Problem 4.5. Plot the analyses from Shasta volcano (below) on Fe-index, MALI, and ASI diagrams. Describe these andesites and dacites based on where they plot on these diagrams. SiO2 TiO2 A1203 Fetot MnO MgO CaO Na20 K20 P205 LOI Sum 82-916 63.32 0.57 16.73 3.749 0.07 3.71 6.02 4.09 1.11 0.17 0.26 99.69 82-96 62.96 0.58 17.01 4.033 0.08 3.44 5.93 4.19 1.2 0.16 0.25 99.73 82-97 63.38 0.59 16.62 4.268 0.07 3.03 5.19 4.00 1.56 0.14 0.47 99.23 83-45 62.98 0.52 17.51 3.877 0.08 2.64 5.52 4.93 1.27 0.16 0.98 99.78 83-54 63.8 0.59 16.14 4.102 0.08 3.11 5.31 4.59 1.57 0.13 0.77 99.69 83-55 62.44 0.63 16.36 4.479 0.08 3.52 5.89 4.32 1.41 0.14 0.61 99.48 97-4 62.21 0.61 17.03 4.374 0.08 3.45 5.95 4.16 1.26 0.18 0.01 99.78 97-6 61.51 0.65 16.81 4.185 0.08 3.57 6.06 4.10 1.23 0.23 0.60 98.87 99-12A 56.9 0.36 17.1 5.382 0.11 5.9 8.82 3.03 0.74 0.13 0.40 99.07 99-12B 55.7 0.54 16.8 6.561 0.14 6.08 9.23 2.88 0.48 0.13 0.19 99.27 99-13 61.5 0.60 17.0 4.392 0.08 3.47 5.97 3.95 1.24 0.23 0.20 98.92 99-14 61.7 0.60 17.0 4.293 0.08 3.45 5.92 4.00 1.23 0.23 0.24 98.98 99-16 61.5 0.65 16.7 4.158 0.08 3.53 6.02 3.98 1.24 0.27 0.56 98.59 99-17 62.4 0.57 17.0 3.879 0.07 3.21 5.86 4.06 1.20 0.22 0.43 98.90 4.158 0.08 3.53 6.07 3.98 1.23 0.27 0.45 98.63 99-18 61.4 0.65 16.8 FeOtot is total iron expressed as Feo Data from Grove et al., 2005. Table for Problem 4.5 T102 Sum 82-916 0.26 99.69 SiO2 63.32 62.96 63.38 82-96 0.25 99.73 82-97 0.47 99.23 83-45 62.98 0.98 99.78 83-54 63.8 0.77 99.69 83-55 62.44 0.61 99.48 A1203 Feo* Mno Mgo Cao Na20 K20 P205 LOI 0.57 16.73 3.749 0.07 3.71 6.02 4.09 1.11 0.17 0.58 17.01 4.033 0.08 3.44 5.93 4.19 1.2 0.16 0.59 16.62 4.268 0.07 3.03 5.19 4 1.56 0.14 0.52 17.51 3.877 0.08 2.64 5.52 4.93 1.27 0.16 0.59 16.14 4.102 0.08 3.11 5.31 4.59 1.57 0.13 0.63 16.36 4.479 0.08 3.52 5.89 4.32 1.41 0.14 0.61 17.03 4.374 0.08 3.45 5.95 4.16 1.26 0.18 0.65 16.81 4.185 0.08 3.57 6.06 4.1 1.23 0.23 0.36 17.1 5.382 0.11 5.9 8.82 3.03 0.74 0.13 0.54 16.8 6.561 0.14 6.08 9.23 2.88 0.48 0.13 0.6 17 4.392 0.08 3.47 5.97 3.95 1.24 0.23 0.6 17 4.293 0.08 3.45 5.92 4 1.23 0.23 0.65 16.7 4.158 0.08 3.53 6.02 1.24 0.27 97-4 62.21 0.01 99.78 97-6 61.51 0.6 98.87 99-12A 56.9 0.4 99.07 99-12B 55.7 0.19 99.27 99-13 61.5 0.2 98.92 99-14 61.7 0.24 98.98 99-16 61.5 3.98 0.56 98.59 99-17 62.4 0.57 17 3.879 0.07 3.21 5.86 4.06 1.2 0.22 0.43 98.9 99-18 61.4 0.65 16.8 4.158 0.08 3.53 6.07 3.98 1.23 0.27 0.45 98.63 FeO* is total iron expressed as Feo Data from Grove et al., 2005
Step by Step Solution
There are 3 Steps involved in it

Get step-by-step solutions from verified subject matter experts