

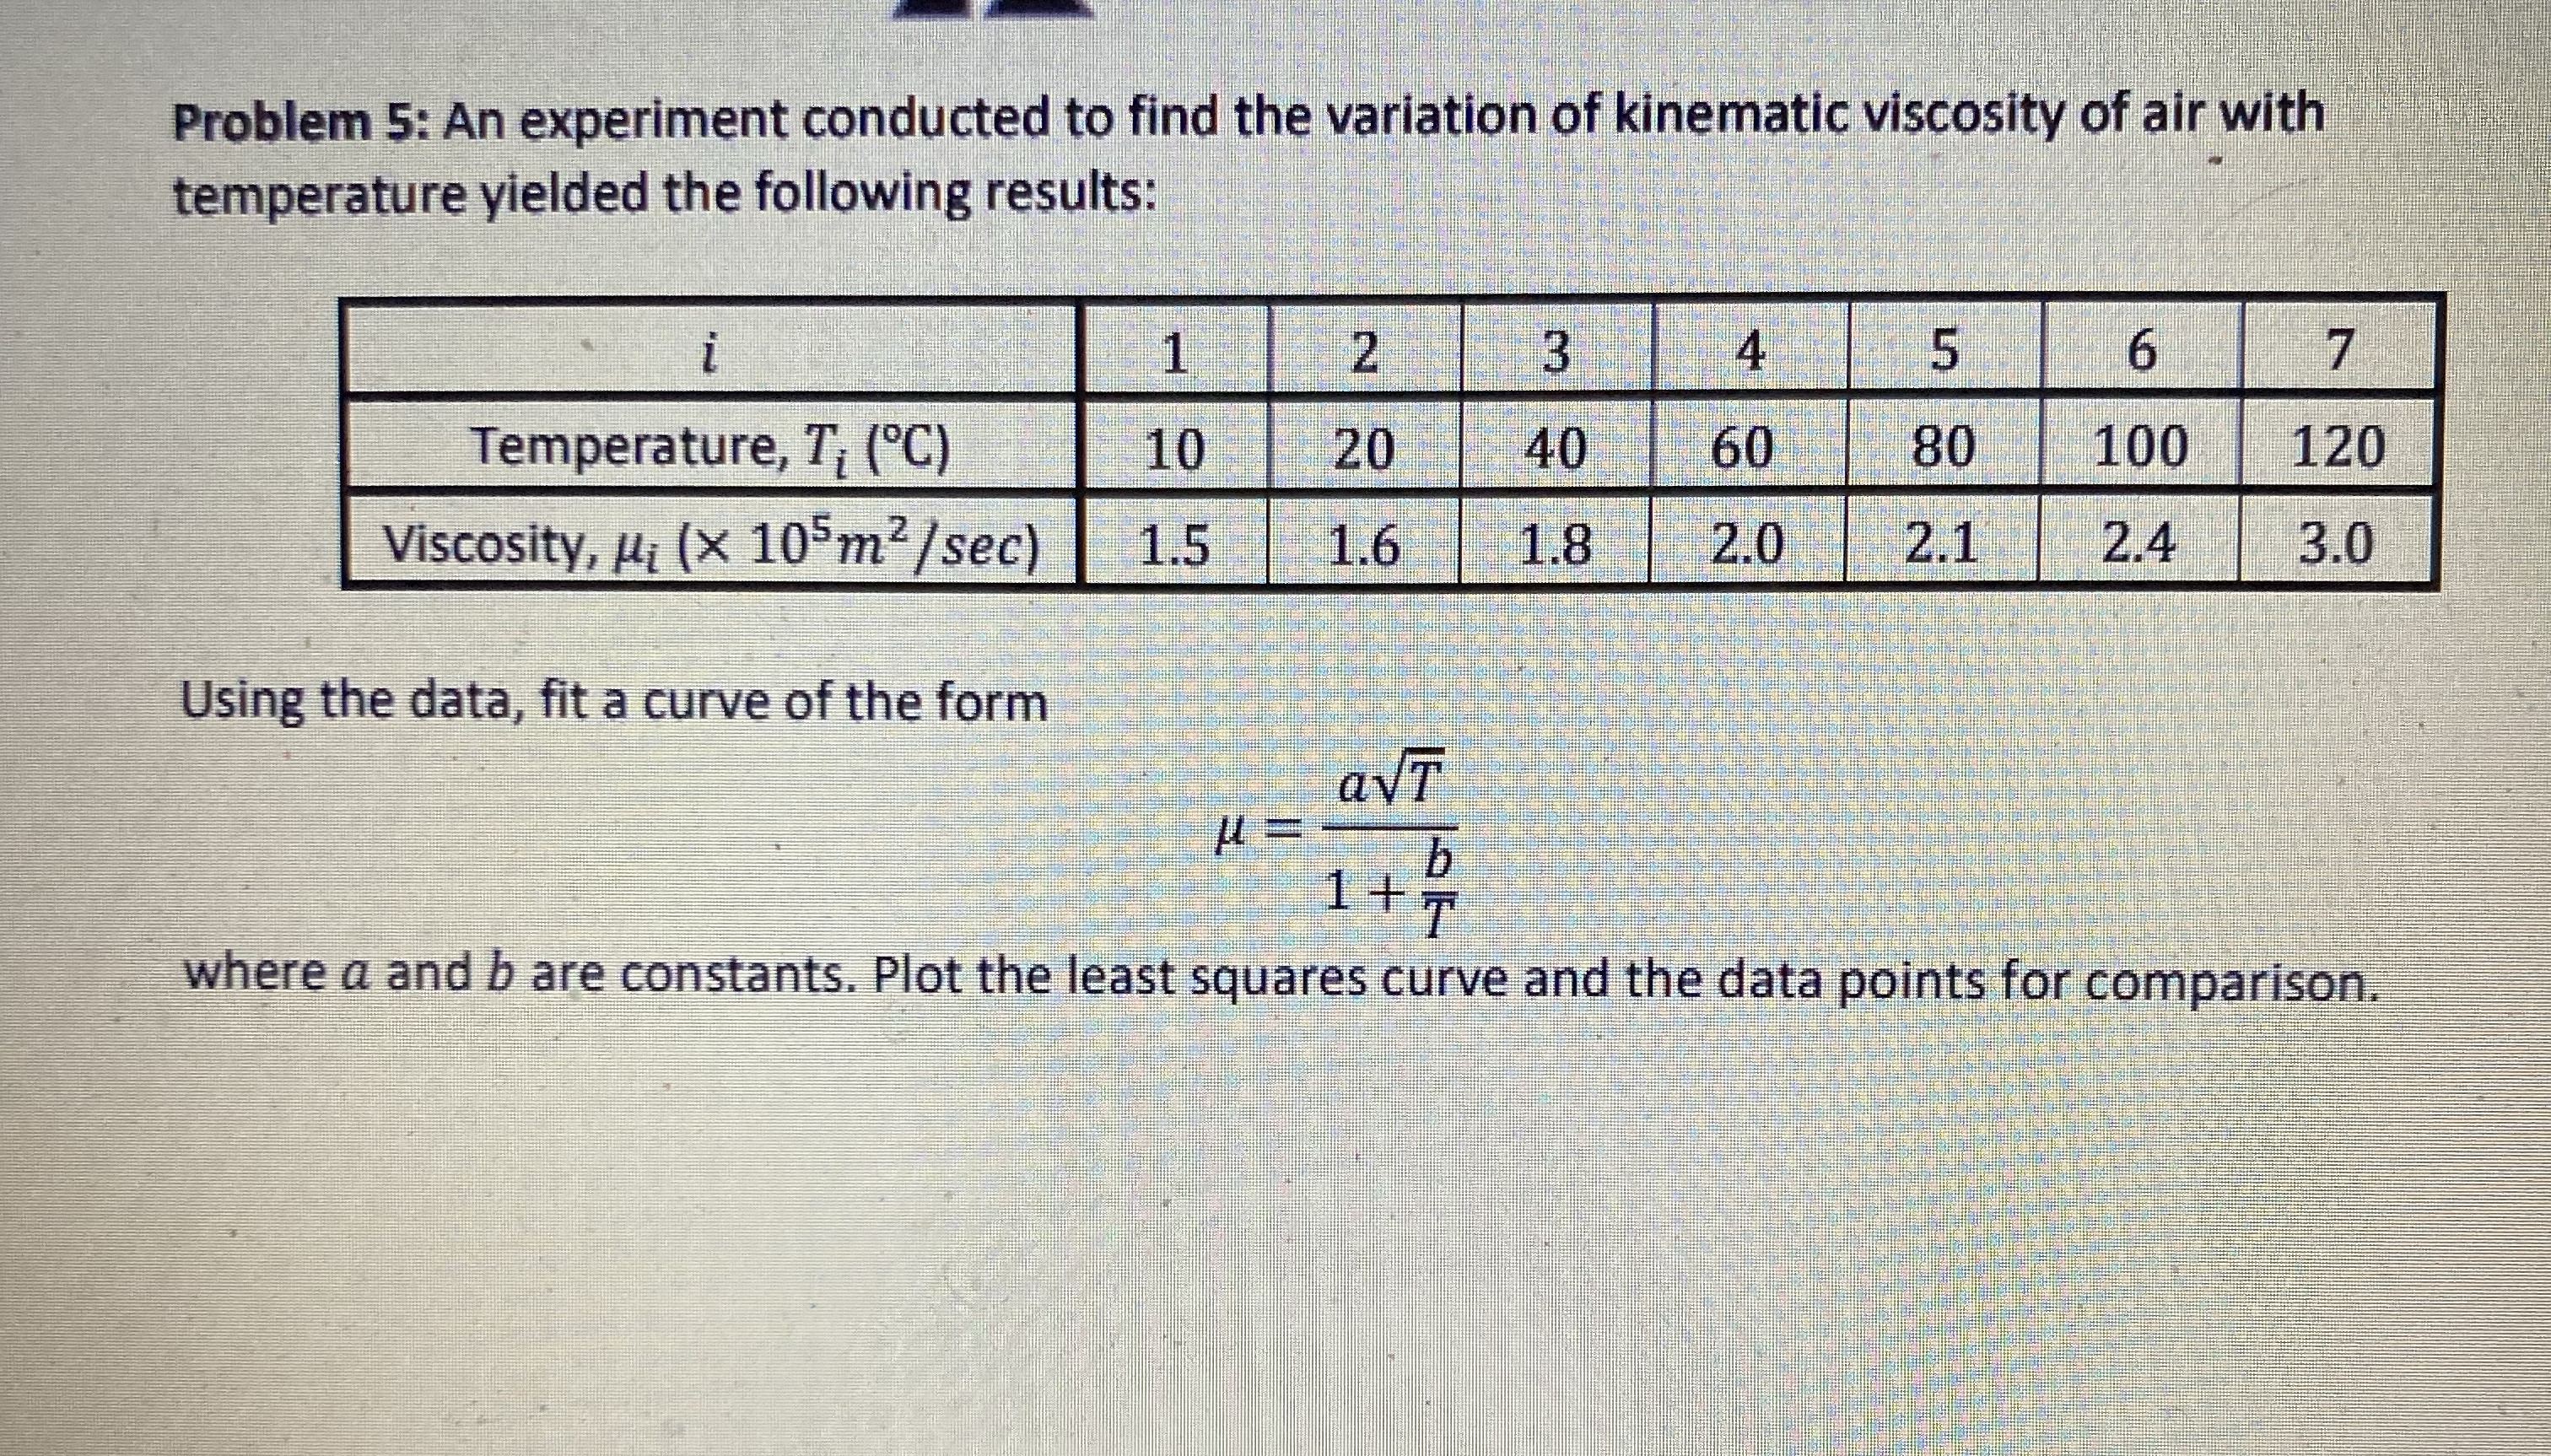
Question: Problem 5 : An experiment conducted to find the variation of kinematic viscosity of air with temperature yielded the following results: table [ [
Problem : An experiment conducted to find the variation of kinematic viscosity of air with temperature yielded the following results:
tableTemperatureViscosity
Using the data, fit a curve of the form
where a and are constants. Plot the least squares curve and the data points for comparison.
Step by Step Solution
There are 3 Steps involved in it
1 Expert Approved Answer
Step: 1 Unlock

Question Has Been Solved by an Expert!
Get step-by-step solutions from verified subject matter experts
Step: 2 Unlock
Step: 3 Unlock