

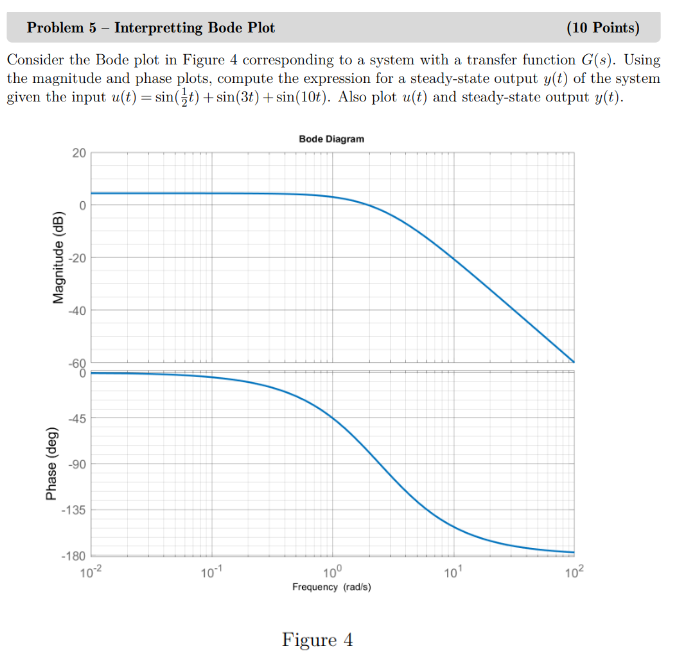
Question: Problem 5 Interpretting Bode Plot ( 1 0 Points ) Consider the Bode plot in Figure 4 corresponding to a system with a transfer function
Problem Interpretting Bode Plot Points Consider the Bode plot in Figure corresponding to a system with a transfer function Gs Using the magnitude and phase plots, compute the expression for a steadystate output yt of the syst
Step by Step Solution
There are 3 Steps involved in it
1 Expert Approved Answer
Step: 1 Unlock

Question Has Been Solved by an Expert!
Get step-by-step solutions from verified subject matter experts
Step: 2 Unlock
Step: 3 Unlock