

Question: PROBLEM 5.15 and more!. points 30 Use MATLAB As depicted in Fig. 1 (Fig. P5.15 of textbook), the velocity of water, y (m/scc), discharged from
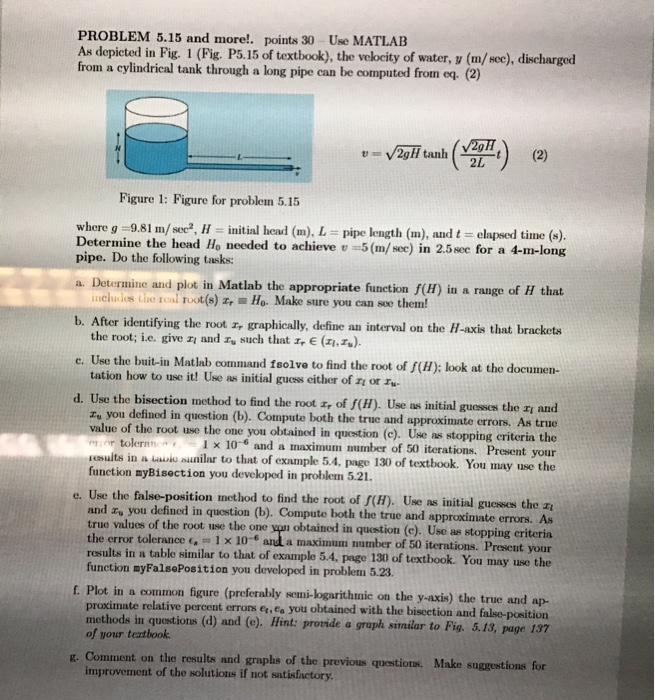
PROBLEM 5.15 and more!. points 30 Use MATLAB As depicted in Fig. 1 (Fig. P5.15 of textbook), the velocity of water, y (m/scc), discharged from a eylindrical tank through a long pipe can be computed from eq. (2) tanh( ) (2) Figure 1: Figure for problem 5.15 where g =981 m/sec,2, l-initial head (m), l.: pipe length (m), andelapsed time (s). Determine the head Ho needed to achieve 5(m/ see) in 2.5see for a 4-m-long pipe. Do the following tasks: a. Determine and plot in Matlab the appropriate function f(H) in a range of H that inclucies the real root(s) z Ho. Make sure you can see them! the root, ie. give zl and zu such that z,e (z.zs). tation how to use it! Use as initial guess cither of zi or r b. After identifying the root z, graphically, define an interval on the H-axis that brackets c. Use the buit-in Matlab command fsolve to find the root of I(H); look at the documen- d. Use the bisection method to find the root , of f(). Use as initial guesses the ay and zu you defined in question (b). Compute both the true and approximate errors. As true value of the root use the one you obtained in question (c). Use as stopping eriteria the 1 x 10- and a maximum mumber of 50 iterations. Present your rcsuits in a tavie aunilar to that of example 5.4, page 130 of textbook. You may use the erior tolern1 function myBisection you developed in problem 5.21. the false-position method to find the root of f(H). Use as initial guesses the and ze you defined in question (b). Compute both the true and approximate erre true values of the root use the one ypu obtained in question (c). Use as stopping criteria tolerance , 1 x 10⁻⁶ ard a maximum number of 50 iterations. Present your of example 5.4, page 30 of textbook. You may use the results in a table similar to that function myFalsePosition you developed in problem 5.23. f. Plot in a common figure (preferably semi-logarithmic on the y-axis) the true and ap- ea you obtained with the bisection and false-position proximate relative percent errons et,Ca methods in questions (d) and (e). Hint: provide a graph similar to Fig. 5.13, page 137 of your tertbook . Comment on the results and graphs of the previous questions. Make suggestions for improvement of the solutions if not satisfactory
Step by Step Solution
There are 3 Steps involved in it

Get step-by-step solutions from verified subject matter experts