

Question: Give me the matlab code for this question PROBLEM 5.15 and more!. points 40- Use MATLAB As depictod in Fig. D (Fig. P5.15 of textbook),
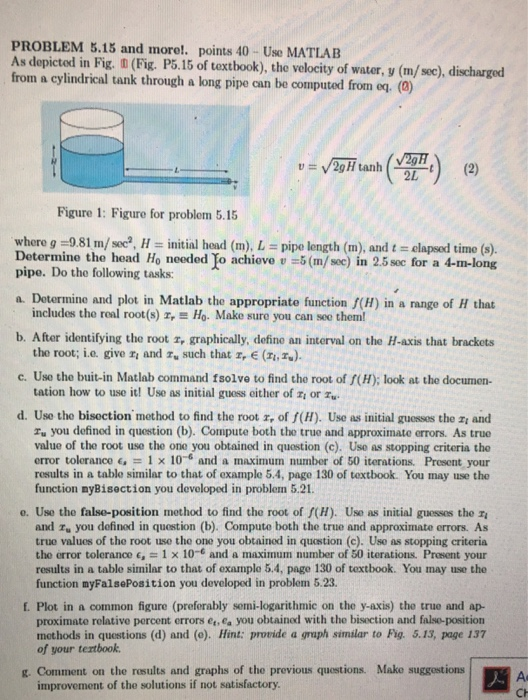
PROBLEM 5.15 and more!. points 40- Use MATLAB As depictod in Fig. D (Fig. P5.15 of textbook), the velocity of water, y (m/sec), discharged from a cylindrical tank through a long pipe can be computed from oq. (3) V2gH 2L Figure 1: Figure for problem 5.15 where g =98l m/seca, H = initial hod (m), L = pipe length (m), and t = elapsed time (s). Determine the head Ho needed Yo achieve u 5 (m/sec) in 2.5 sec for a 4-m-long pipe. Do the following tasks: a. Determine and plot in Matlab the appropriate function (H) in a range of H that b. After identifying the root r, graphically, define an interval on the H-axis that brackets c. Use the buit-in Matlab command fsolve to find the root of f(H); look at the documen- d. Use the bisoction method to find the root r, of f(H). Use as initial guosses the zi and includes the roal root(s) r, Ho. Make sure you can seo them! the root; i.e. give r and r, such that , E (T) tation how to use it! Use as initial guess either of z or ru you defined in question (b). Compute both the true and approximate errors. As true value of the root use the one you obtained in quostion (c). Use as stopping criteria tho error tolerance G = 1 x 10⁻⁶ and a maximum number of 50 iterations. Present your rosults in a table similar to that of example 5.4, page 130 of textbook. You may use the function nyBisection you developed in problem 5.21. e. Use the false-position method to find the root of f(H). Use as initial guessos the and ru you defined in question (b). Compute both the true and approximate errors. As true values of the root use the one you obtainod in quostion (c). Use as stopping criteria the error tolerance , 1 x 10- and a maximum number of 50 iterations. Prosent your results in a table similar to that of example 5.4, page 130 of textbook. You may use the function myFalsePosition you developed in problem 5.23. f. Plot in a common figure (preforably semi-logarithmic on the y-axis) the true and ap- proximate relative percent errors et,a you obtained with the bisection and false-position mothods in questions (d) and (o). Hint: provide a gruph similar to Fig. 5.13, page 137 of your tertbook. g. Comment on the rosults and graphs of the previous questions. Make suggestions Ac Ch improvement of the solutions if not satisfactory
Step by Step Solution
There are 3 Steps involved in it

Get step-by-step solutions from verified subject matter experts