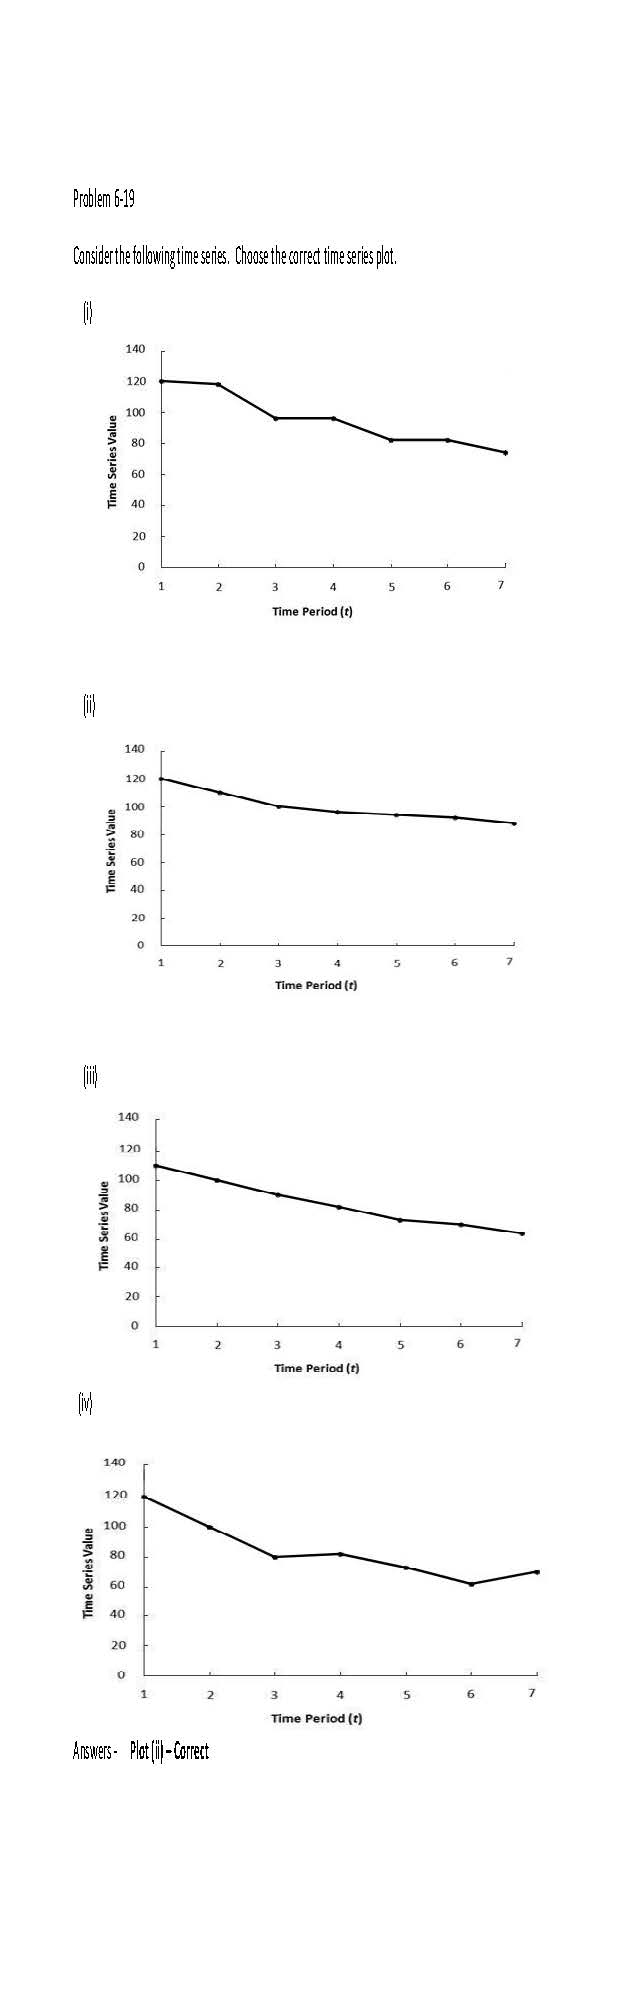
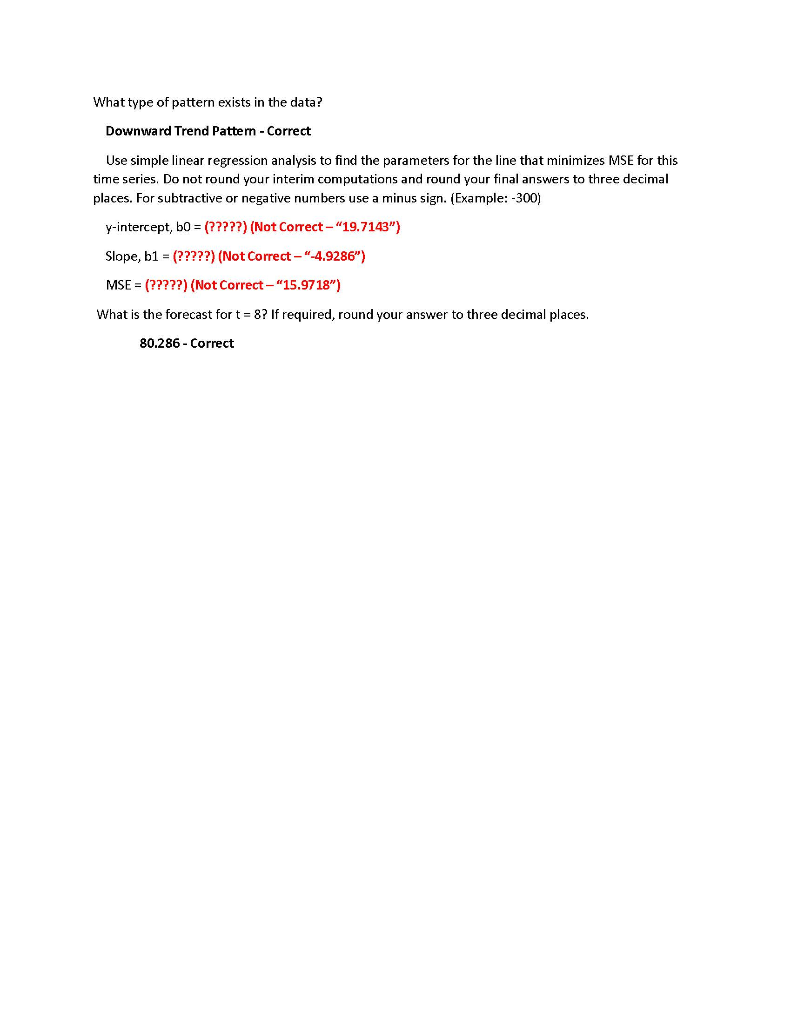
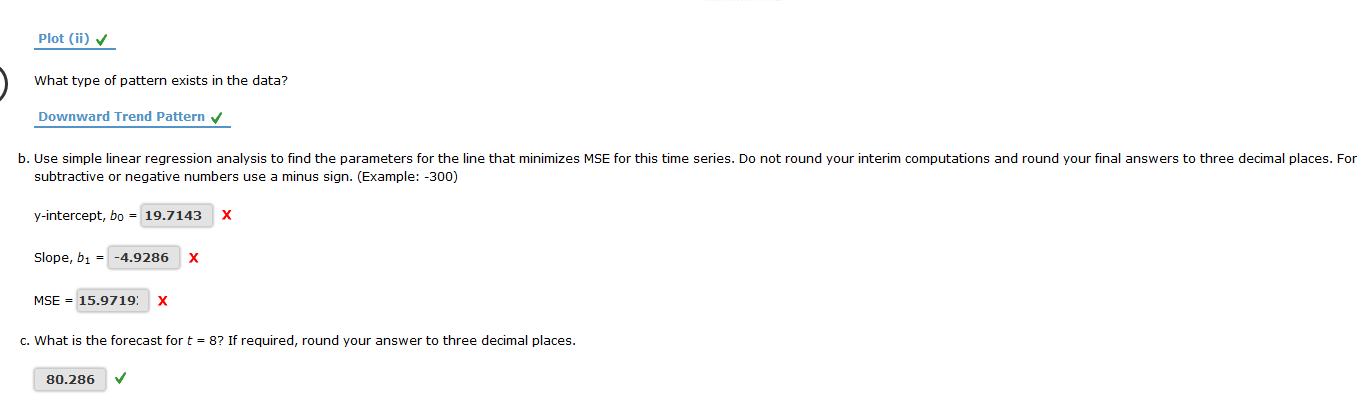
Question: Problem 6-19 Consider the following time series. Choose the correct time series plot. Time Series Value 12 3 4 5 6 7 Time Period (t)

Problem 6-19 Consider the following time series.

Problem 6-19 Consider the following time series.

Problem 6-19 Consider the following time series.

Problem 6-19 Consider the following time series. Choose the correct time series plot. Time Series Value 12 3 4 5 6 7 Time Period (t) Time Series Value Time Period (t) Time Series Value 5 6 7 3 4 Time Period (t) Time Series Value NF Time Period (t) Answers- Plot (l-Correct What type of pattern exists in the data? Downward Trend Pattern - Correct Use simple linear regression analysis to find the parameters for the line that minimizes MSE for this time series. Do not round your interim computations and round your final answers to three decimal places. For subtractive or negative numbers use a minus sign. (Example: -300) y-intercept, bo = (?????) (Not Correct - "19.7143") Slope, b1 = (?????) (Not Correct -"-4.9286") MSE = (?????) (Not Correct -"15.9718") What is the forecast for t = 8? If required, round your answer to three decimal places. 80.286 - Correct Plot (ii) What type of pattern exists in the data? Downward Trend Pattern b. Use simple linear regression analysis to find the parameters for the line that minimizes MSE for this time series. Do not round your interim computations and round your final answers to three decimal places. For subtractive or negative numbers use a minus sign. (Example: -300) y-intercept, bo = 19.7143 x Slope, b1 = -4.9286 x MSE = 15.9719: X c. What is the forecast for t = 8? If required, round your answer to three decimal places. 80.286 Problem 6-19 Consider the following time series. Choose the correct time series plot. Time Series Value 12 3 4 5 6 7 Time Period (t) Time Series Value Time Period (t) Time Series Value 5 6 7 3 4 Time Period (t) Time Series Value NF Time Period (t) Answers- Plot (l-Correct What type of pattern exists in the data? Downward Trend Pattern - Correct Use simple linear regression analysis to find the parameters for the line that minimizes MSE for this time series. Do not round your interim computations and round your final answers to three decimal places. For subtractive or negative numbers use a minus sign. (Example: -300) y-intercept, bo = (?????) (Not Correct - "19.7143") Slope, b1 = (?????) (Not Correct -"-4.9286") MSE = (?????) (Not Correct -"15.9718") What is the forecast for t = 8? If required, round your answer to three decimal places. 80.286 - Correct Plot (ii) What type of pattern exists in the data? Downward Trend Pattern b. Use simple linear regression analysis to find the parameters for the line that minimizes MSE for this time series. Do not round your interim computations and round your final answers to three decimal places. For subtractive or negative numbers use a minus sign. (Example: -300) y-intercept, bo = 19.7143 x Slope, b1 = -4.9286 x MSE = 15.9719: X c. What is the forecast for t = 8? If required, round your answer to three decimal places. 80.286

Step by Step Solution

There are 3 Steps involved in it

1 Expert Approved Answer
Step: 1 Unlock blur-text-image
Question Has Been Solved by an Expert!

Get step-by-step solutions from verified subject matter experts

Step: 2 Unlock
Step: 3 Unlock

Students Have Also Explored These Related General Management Questions!