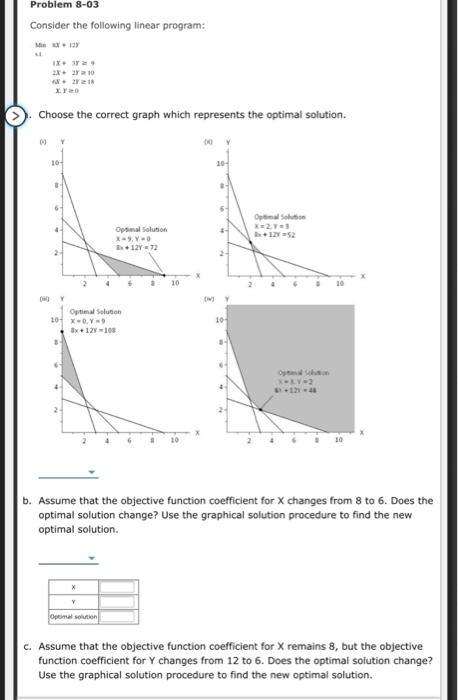
Question: Problem 8-03 Consider the following linear program: 2x+ 2210 28 Ya Choose the correct graph which represents the optimal solution. 00 10- 10 Optimal Solution

Problem 8-03 Consider the following linear
Problem 8-03 Consider the following linear program: 2x+ 2210 28 Ya Choose the correct graph which represents the optimal solution. 00 10- 10 Optimal Solution 12=52 B+12y = 72 MY 00Y Om Solution 101 XY 1x + 12V 108 10 XL-2 b. Assume that the objective function coefficient for changes from 8 to 6. Does the optimal solution change? Use the graphical solution procedure to find the new optimal solution. Ops C. Assume that the objective function coefficient for X remains 8, but the objective function coefficient for Y changes from 12 to 6. Does the optimal solution change? Use the graphical solution procedure to find the new optimal solution. Optimal Solution 101 XY 1.12100 10 b. Assume that the objective function coefficient for changes from 8 to 6. Does the optimal solution change? Use the graphical solution procedure to find the new optimal solution. Optima C. Assume that the objective function coefficient for X remains 8, but the objective function coefficient for Y changes from 12 to 6. Does the optimal solution change? Use the graphical solution procedure to find the new optimal solution. X Y Comas d. How would this objective coefficient range information help you answer parts (b) and (C) prior to resolving the problem? The sensitivity report for the linear program in part (a) provides the following objective coefficient range information: 12.000 The input in the box below will not be graded, but may be reviewed and considered by your instructor Problem 8-03 Consider the following linear program: 2x+ 2210 28 Ya Choose the correct graph which represents the optimal solution. 00 10- 10 Optimal Solution 12=52 B+12y = 72 MY 00Y Om Solution 101 XY 1x + 12V 108 10 XL-2 b. Assume that the objective function coefficient for changes from 8 to 6. Does the optimal solution change? Use the graphical solution procedure to find the new optimal solution. Ops C. Assume that the objective function coefficient for X remains 8, but the objective function coefficient for Y changes from 12 to 6. Does the optimal solution change? Use the graphical solution procedure to find the new optimal solution. Optimal Solution 101 XY 1.12100 10 b. Assume that the objective function coefficient for changes from 8 to 6. Does the optimal solution change? Use the graphical solution procedure to find the new optimal solution. Optima C. Assume that the objective function coefficient for X remains 8, but the objective function coefficient for Y changes from 12 to 6. Does the optimal solution change? Use the graphical solution procedure to find the new optimal solution. X Y Comas d. How would this objective coefficient range information help you answer parts (b) and (C) prior to resolving the problem? The sensitivity report for the linear program in part (a) provides the following objective coefficient range information: 12.000 The input in the box below will not be graded, but may be reviewed and considered by your instructor

Step by Step Solution

There are 3 Steps involved in it

1 Expert Approved Answer
Step: 1 Unlock blur-text-image
Question Has Been Solved by an Expert!

Get step-by-step solutions from verified subject matter experts

Step: 2 Unlock
Step: 3 Unlock

Students Have Also Explored These Related General Management Questions!