

Question: Problem 85 continued... Please calculate the following ratios, compare to the e the following ratios, compare to the industry average and write a short conclusion
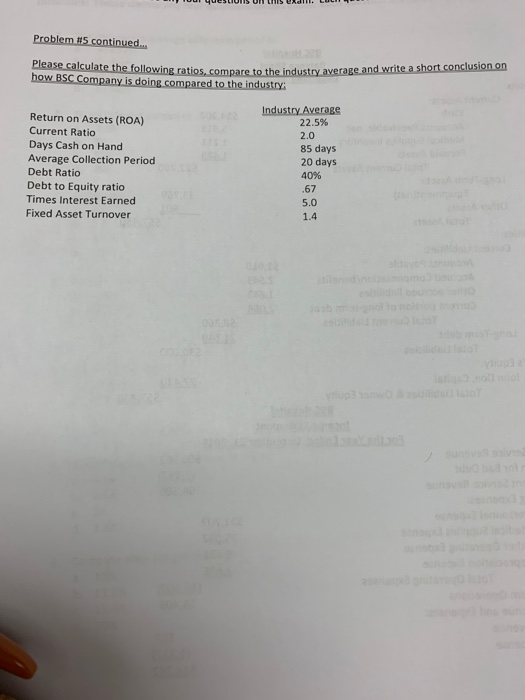
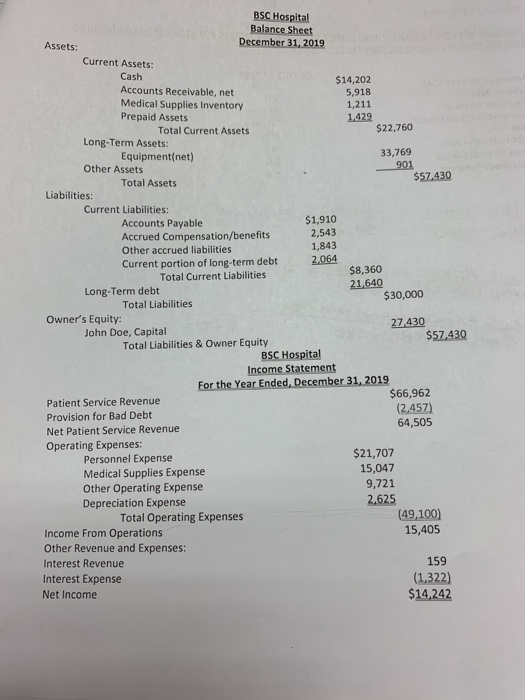
Problem 85 continued... Please calculate the following ratios, compare to the e the following ratios, compare to the industry average and write a short conclusion on how BSC Company is doing compared to the industry: Return on Assets (ROA) Current Ratio Days Cash on Hand Average Collection Period Debt Ratio Debt to Equity ratio Times Interest Earned Fixed Asset Turnover Industry Average 22.5% 2.0 85 days 20 days 40% .67 5.0 1.4 $30,000 BSC Hospital Balance Sheet Assets: December 31, 2019 Current Assets: Cash $14,202 Accounts Receivable, net 5,918 Medical Supplies Inventory 1,211 Prepaid Assets 1.429 Total Current Assets $22,760 Long-Term Assets: Equipment(net) 33,769 Other Assets 901 Total Assets $57.430 Liabilities: Current Liabilities: Accounts Payable $1,910 Accrued Compensation/benefits 2,543 Other accrued liabilities 1,843 Current portion of long-term debt 2,064 Total Current Liabilities $8,360 Long-Term debt 21.640 Total Liabilities Owner's Equity: John Doe, Capital 27.430 $57,430 Total Liabilities & Owner Equity BSC Hospital Income Statement For the Year Ended, December 31, 2019 Patient Service Revenue $66,962 Provision for Bad Debt (2,457) Net Patient Service Revenue 64,505 Operating Expenses: Personnel Expense $21,707 Medical Supplies Expense 15,047 Other Operating Expense 9,721 Depreciation Expense 2,625 Total Operating Expenses (49.100) Income From Operations 15,405 Other Revenue and Expenses: Interest Revenue 159 Interest Expense (1,322) Net Income $14,242
Step by Step Solution
There are 3 Steps involved in it

Get step-by-step solutions from verified subject matter experts