

Question: Problem P 8 - 1 8 P 8 - 1 8 Portfolio analysis You have been given the historical return data shown in the first
Problem P
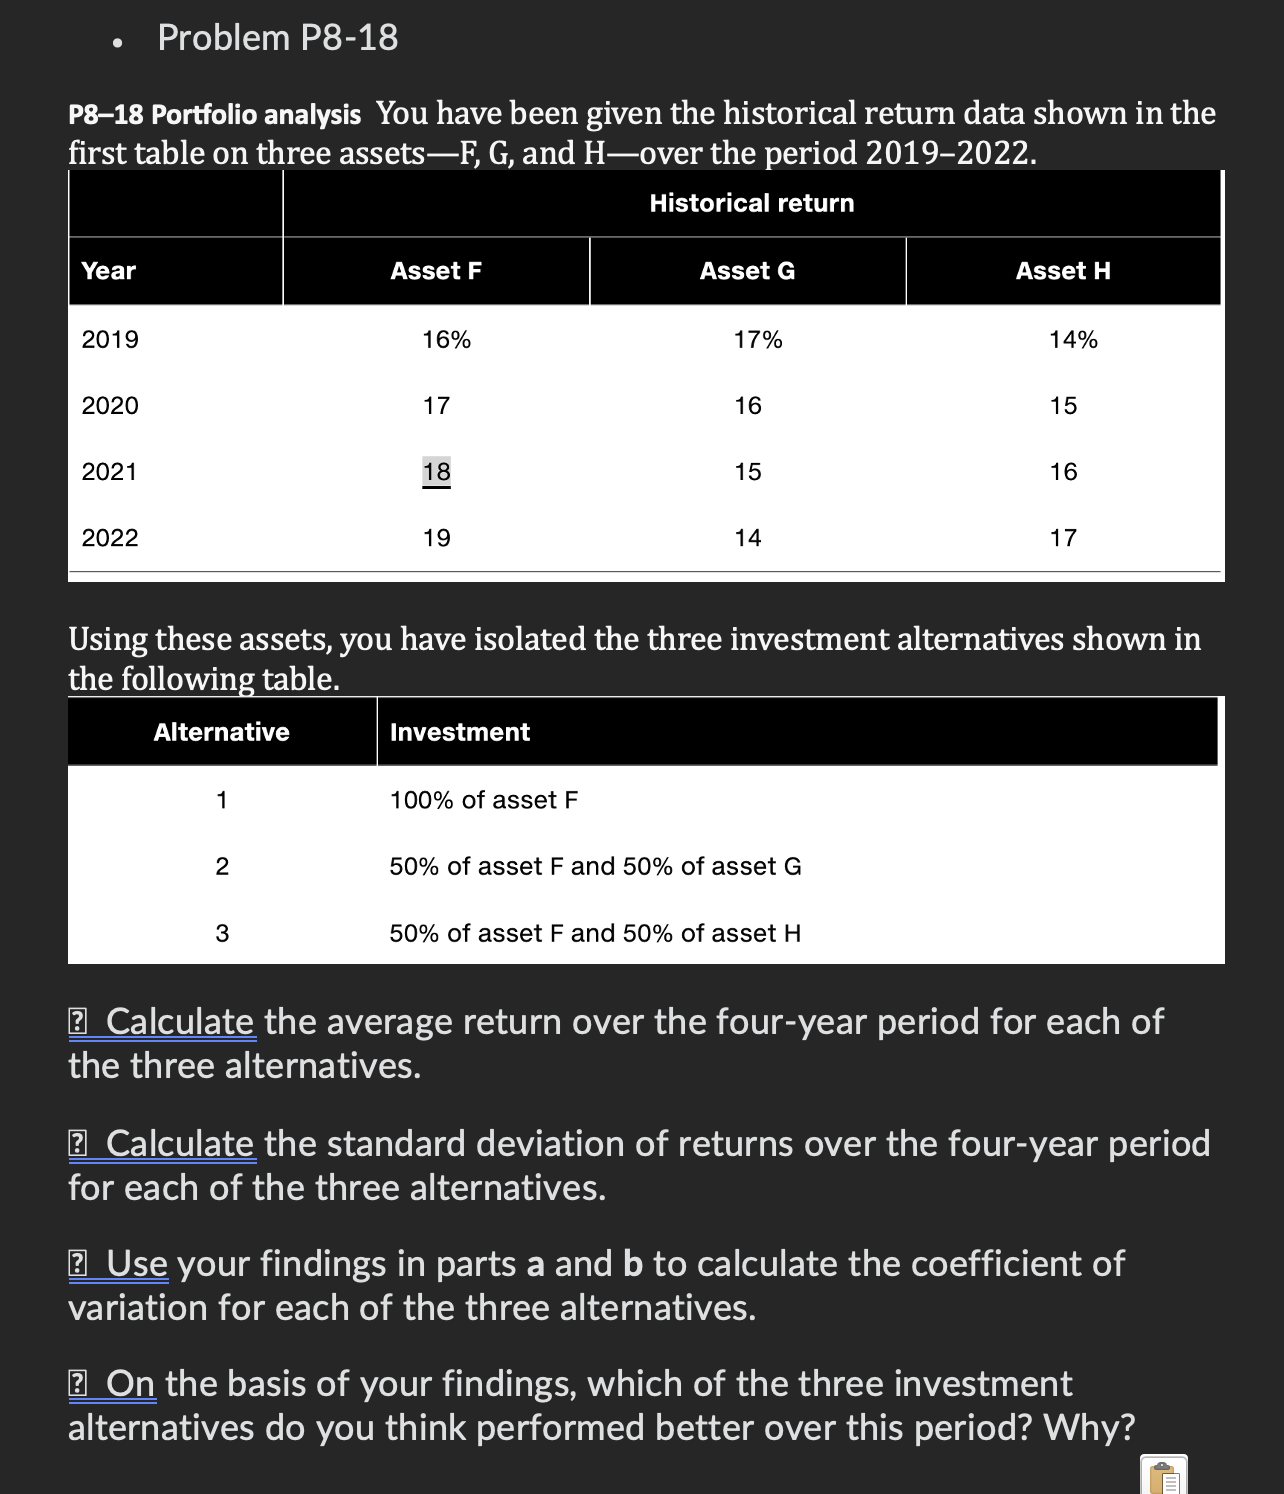
P Portfolio analysis You have been given the historical return data shown in the
first table on three assetsF G and Hover the period
Using these assets, you have isolated the three investment alternatives shown in
the following table.
Calculate the average return over the fouryear period for each of
the three alternatives.
Calculate the standard deviation of returns over the fouryear period
for each of the three alternatives.
Use your findings in parts a and to calculate the coefficient of
variation for each of the three alternatives.
On the basis of your findings, which of the three investment
alternatives do you think performed better over this period? Why?
Step by Step Solution
There are 3 Steps involved in it
1 Expert Approved Answer
Step: 1 Unlock

Question Has Been Solved by an Expert!
Get step-by-step solutions from verified subject matter experts
Step: 2 Unlock
Step: 3 Unlock