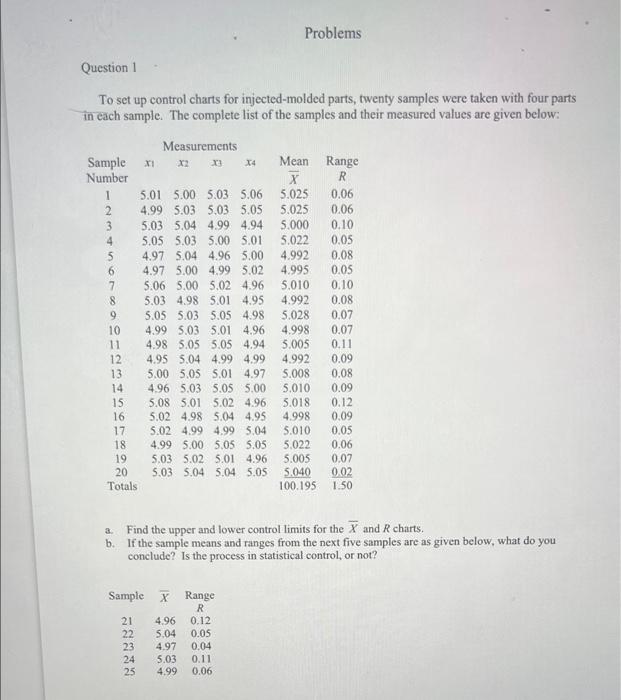
Question: Problems Question 1 To set up control charts for injected-molded parts, twenty samples were taken with four parts in each sample. The complete list of

Problems Question 1 To set up control charts for
Problems Question 1 To set up control charts for injected-molded parts, twenty samples were taken with four parts in each sample. The complete list of the samples and their measured values are given below: Measurements Sample XI X2 X 14 Mean Range Number X R 1 5.01 5.00 5.03 5.06 5.025 0.06 2 4.99 5.03 5.03 5.05 5.025 0.06 3 5.03 5.04 4.99 4.94 5.000 0.10 4 5.05 5.03 5.00 5.01 5.022 0.05 5 4.97 5.04 4.96 5.00 4.992 0.08 6 4.97 5.00 4.995.02 4.995 0.05 5.06 5.00 5.02 4.96 5.010 0.10 8 5.03 4.98 5.01 4.95 4.992 0.08 9 5.05 5.03 5.05 4.98 5.028 0,07 10 4.99 5.03 5.01 4.96 4.998 0.07 11 4.98 5.05 5.05 4.94 5.005 0.11 12 4.95 5.04 4.99 4.99 4.992 0.09 13 5.00 5.05 5.01 4.97 5.008 0.08 14 4.96 5.03 5.05 5.00 5.010 0.09 15 5.08 5.01 5.02 4.96 3.018 0.12 16 5.02 4.98 5.04 4.95 4.998 0.09 17 5.02 4.99 4.99 5.04 5.010 0.05 18 4.99 5.00 5.05 5.05 5.022 0.06 19 5.03 5.02 5.01 4.96 5.005 0.07 20 5.03 5.04 5.04 5.05 5.040 0.02 Totals 100.195 1.50 Find the upper and lower control limits for the X and R charts. b. If the sample means and ranges from the next five samples are as given below, what do you conclude? Is the process in statistical control, or not? Sample X Range R 21 4.96 0.12 22 5.04 0.05 23 4.97 0.04 24 5.03 25 4.99 0.06 0.11

Step by Step Solution

There are 3 Steps involved in it

1 Expert Approved Answer
Step: 1 Unlock blur-text-image
Question Has Been Solved by an Expert!

Get step-by-step solutions from verified subject matter experts

Step: 2 Unlock
Step: 3 Unlock

Students Have Also Explored These Related General Management Questions!